Blog Post
Insight: What a Decade! Reflections on the Newest Utah State and County Population Estimates
By: Emily Harris
Note: The opinions expressed are those of the author alone and do not reflect an institutional position of the Gardner Institute. We hope the opinions shared contribute to the marketplace of ideas and help people as they formulate their own INFORMED DECISIONS™.
Dec 9, 2019 – The Gardner Institute has been involved in Utah’s locally produced population estimates since 2015. In that initial year, we created a series that went back to 2010 (the last decennial census) and have since created these estimates annually in collaboration with the Utah Population Committee (UPC). It’s been an eventful decade, and there were a few key events over the last nine years that significantly impacted Utah’s demographic patterns:
- The Great Recession left an imprint on households, fertility, and economic dynamics that is still being felt in 2019.
- In 2012, a missionary age policy change in the Church of Jesus Christ of Latter-day Saints rattled the migration trends in the state from 2013 to 2015.
- A federal tax law change in 2017 impacted filing habits and a key source of input data for population estimates.
- The rebounding housing market, subsequent housing shortages, and affordability issues have impacted fertility, mobility, and household formation in multiple ways over the last decade.
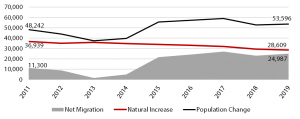
All of these circumstances feed off of each other to create a changing demographic landscape for Utah and its counties. We see these changes as we look at the newest set of UPC population estimates and reflect on how they have changed since 2010. Utah’s solid population growth has been stabilizing over the last few years, with annual growth ranging between 55,500 to 59,000 since 2015 (2019 growth is 53,596 or 1.69%). As annual births continue to decrease and deaths increase, natural increase has become a smaller share of population growth, particularly since 2015. Natural increase started as 77% of population growth in 2011 and is currently 53% of population growth (net migration accounts for the other 47%).
Figure 1: Utah Components of Population Change, 2011-2019

Source: Utah Population Committee, Kem C. Gardner Policy Institute
Washington County was the fastest growing county this year with 5.6% growth since 2018. Net migration accounts for 92% of that growth, but don’t expect all of the new migrants to be retirement age. Age-specific migration data point to a wide variety of age groups moving into the area. Washington County’s total net migration, 8,768, is only 169 shy of Utah County’s net migration.

Source: Utah Population Committee, Kem C. Gardner Policy Institute
And while we are on the topic of Utah County, this was the first year that Utah County’s net migration was the major contributor of population growth (barely, accounting for 50.1% of total growth, but still!). This is a clear signal of Utah County’s standing, both locally and nation-wide, as it draws more residents and jobs to the southern end of the Wasatch Front.
These are only a few examples of the varying population dynamics occurring within Utah, but each county has its own story that unfolds over time. As we near the 2020 Decennial Census, our estimates become less reliable, our estimation work more challenging, and we are eager to acquire more concrete enumeration data that can add more definitive detail to these stories.
You can read the full population estimates brief, download the estimates data, and view top level visualizations here.
Emily Harris is a demographer at the Kem C. Gardner Policy Institute.


