Blog Post
Insight: Utah’s Infant Mortality Rate
By: Mike Hollingshaus
Note: The opinions expressed are those of the author alone and do not reflect an institutional position of the Gardner Institute. We hope the opinions shared contribute to the marketplace of ideas and help people as they formulate their own INFORMED DECISIONS™.
Nov 18, 2022 – Two of the most important population health metrics are the life expectancy at birth (LEB) and the infant mortality rate (IMR). A previous blog post explored Utah’s LEB, and this blog focuses on IMRs, though the two are clearly linked. IMR is the share of infants that die prior to reaching their first birthday, multiplied by 1,000, and is an important indicator of health, development, and equality. The Population Reference Bureau publishes IMRs for several countries, and values range from a low IMR of approximately 2 (in Scandinavian countries) to a high of 75 (in Sierra Leone). The United States and Utah have IMRs between 5 and 6.
Why study infant mortality rates?
There are few things more tragic than the death of a newborn and having a lower IMR is good because it means fewer of those deaths have occurred. But IMR is also a prime indicator of health and development. Technology has been very successful at keeping babies alive, and one of the first things societies seek to accomplish with innovative technology is to reduce their IMR. The improvements in IMR over the past century have vastly increased LEB.
Furthermore, IMR is an important indicator of equality. Social determinants of health play a larger role for infants compared to adults. Adults can take some responsibility for individual health behaviors such as smoking and drinking, but infants clearly cannot. Therefore, social determinants such as economic inequality, social support, and health care availability are much more clearly linked to infant health, leading some experts to label IMR disparities “the first injustice.”
State-level data for 2019
Here are some state-level statistics for IMR (per 1,000) in 2019:
- Lowest: 2.8 in Vermont (1st)
- Highest: 8.8 in Mississippi (51st)
- Utah: 5.2 (21st)
- United States: 5.5
At the same time, LEB statistics show:
- Highest: 81.8 in Hawaii (1st)
- Lowest: 74.7 in Mississippi (51st)
- Utah: 80.1 (11th)
- United States: 79.1
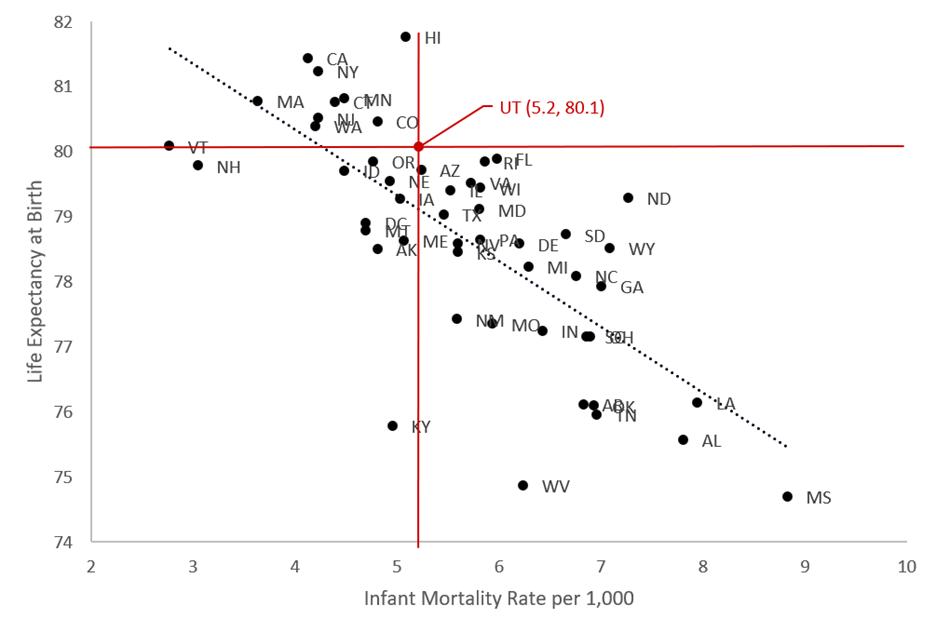
Utah ranked 11th best for LEB, but only 21st best for IMR. Death rates at other ages also affect LEB, so IMR is not a perfect predictor of LEB—if it were, there would be no point in measuring both. The 2019 correlation between the two was -0.73, where -1.00 would indicate perfect prediction. Figure 1 illustrates this connection using data points for each state and D.C., with a dashed trend line for the correlation. The red lines indicate Utah’s relative position.
Figure 1. Infant mortality rate and life expectancy for 50 states and D.C. with Utah emphasis and trendline, 2019
Source: USA Mortality DataBase, Kem C. Gardner Policy Institute
Time trends
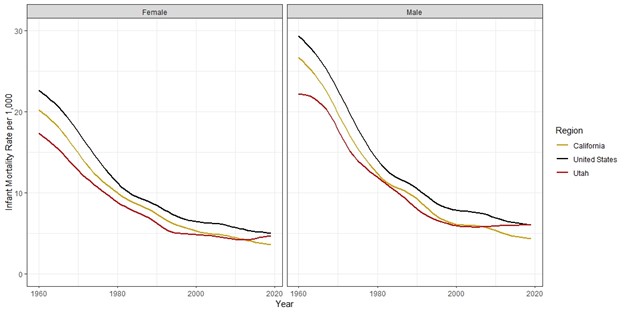
Figure 2 compares IMRs for Utah to the U.S. and California. The U.S. and California rates provide meaningful comparisons because the former is the national average while the latter has recently been consistently low. Furthermore, both have large populations that produce stable IMRs for comparison. Data are smoothed so the graphs are easier to read and interpret.
Figure 2. Sixty years of infant mortality rates for California, United States, and Utah, 1960-2019
Source: USA Mortality DataBase, Kem C. Gardner Policy Institute
Here are some key takeaways:
- Male infants generally die at higher rates compared to females.
- Improvements have slowed over time. But the lower rates in Scandinavian countries prove it is possible to further improve infant mortality in the U.S.
- California and the U.S. have continued making slow improvements, but Utah has seen little improvement since the early 1990s for females and the 2000s for males.
- In the past decade or so, Utah rates appear to have risen slightly for both males and females, approaching the national average and even rising above California despite having historically lower rates.
- Recent rises are not confined to Utah. While not shown here, other states such as Hawaii and Colorado have also seen increases in IMRs. Whether this trend continues remains to be seen.
Future research should seek to explain reasons for these IMR trends, and also quantify how infant deaths have impacted Utah’s LEB compared to deaths at other ages.
Data notes
These estimates were extracted from the USA Mortality DataBase, which uses rigorous protocols to produce demographic life tables that are consistent across geography and time. The Utah Department of Health also publishes estimates of LEB and IMR through their IBIS portal. Estimates from both sources are very similar.
Mike Hollingshaus is a senior demographer at the Kem C. Gardner Policy Institute.


