Blog Post
Insight: Pandemic Learning Loss: Diving Deeper into the Data
By: Andrea Thomas Brandley
Note: The opinions expressed are those of the author alone and do not reflect an institutional position of the Gardner Institute. We hope the opinions shared contribute to the marketplace of ideas and help people as they formulate their own INFORMED DECISIONS™
Nov 28, 2022 – Since March 2020 when Utah K-12 students were sent home from school, concerns about learning loss have been top of mind for teachers, parents, and community members statewide. Education impacts so many lifelong outcomes that fears about students falling behind extend far beyond education outcomes alone. Utah’s students are Utah’s future. They will be our teachers, doctors, business owners, political leaders, parents, and community members. Ensuring their success may well be the best way to ensure that Utah’s economy and community life continue to thrive for many years to come.
National Assessment of Education Progress (NAEP) results released this fall show widespread learning loss nationwide.[i] On average, U.S. public school students in grades 3–8 lost the equivalent of a half year of learning in math and a quarter of a year in reading. Relative to other states, Utah students fared better. While Utah saw statistically significant declines in 4th grade math and reading, Utah showed no significant change in 8th grade math and reading. Utah was the only state in the nation where the eighth-grade math declines were not statistically significant. No states saw statistically significant improvements in math or reading at either grade-level.
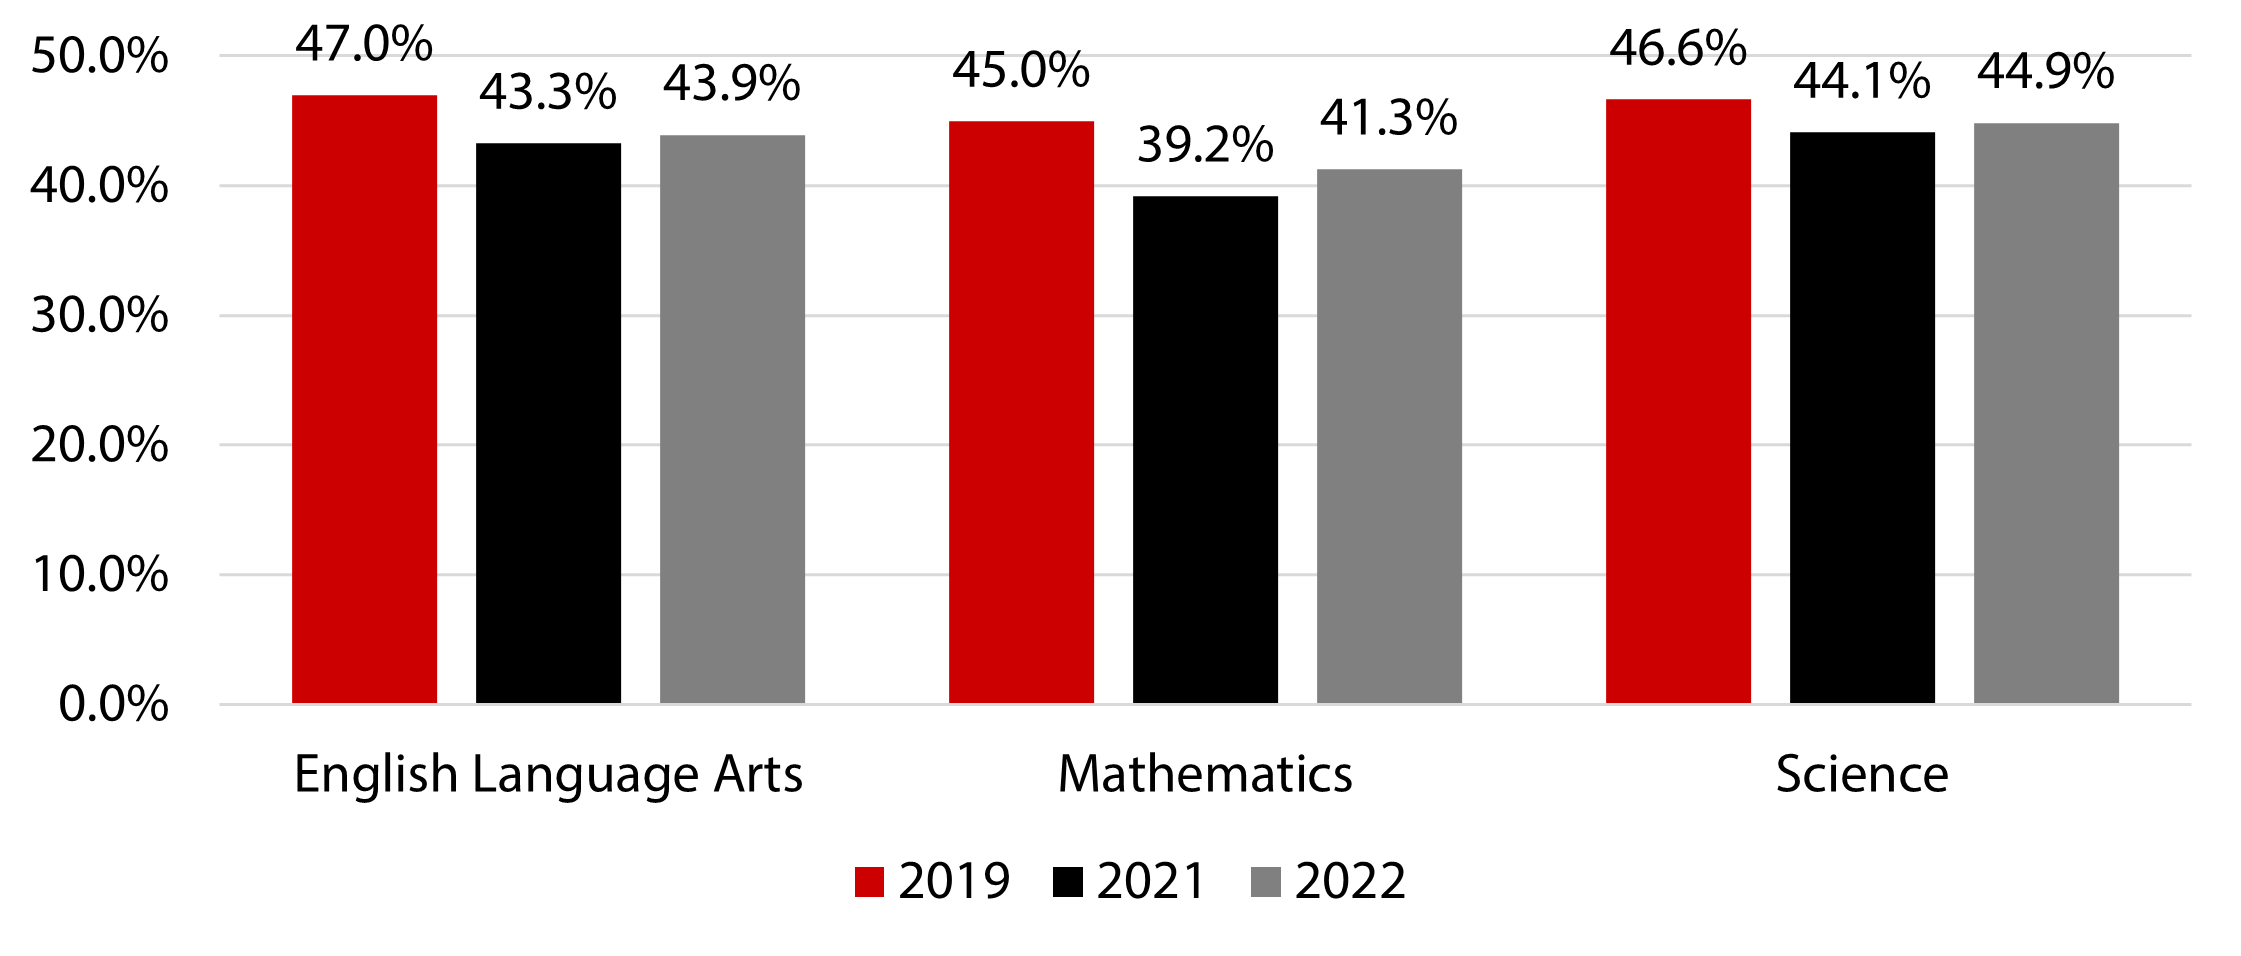
Examining RISE (grades 3-8) and ASPIRE (grades 9-12) test results can provide additional statewide insights. Figure 1 shows average statewide proficiency rates in English, math, and science. These results show that on average, proficiency rates fell from 2019 to 2021, and while they rose slightly from 2021 to 2022, they are still below 2019 (pre-pandemic) levels.
Figure 1: Utah Average Proficiency Rates for Grades 3-8, 2019, 2021, & 2022
Source: Kem C. Gardner Policy Institute analysis of Utah State Board of Education data
While seeing nationwide and statewide results can shed some light on pandemic learning loss, diving deeper into the data provides much more context. Results vary significantly across different student groups and school districts. Even statewide results differ by grade level and subject. For example, statewide English Language Arts scores for grades 9-12 continued to fall from 2021 to 2022 even after the initial drop in achievement from 2019 to 2021.
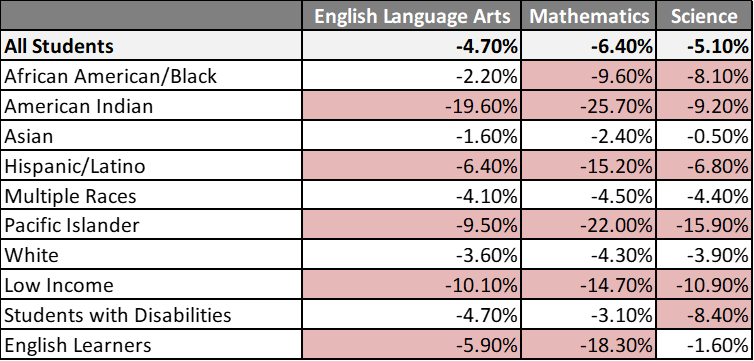
Table 1 highlights differences in learning loss across various demographic groups. Cells shown in red are worse than the statewide average. Key insights include:
- Low-income students’ proficiency rates fell between two and three times more than the state average across all three subject areas.
- Students identifying as White, Asian, or multiple races had proficiency rates that fell by less than the state average across all three subject areas.
- American Indian, Hispanic/Latino, and Pacific Islander students’ proficiency rates fell by more than the state average across all three subject areas.
Table 1: Change in RISE Proficiency Rates for Utah Students from 2019 to 2022
Note: RISE test scores include grades 3-8 for math and English Language Arts and grades 4-8 for science. Source: Kem C. Gardner Policy Institute analysis of Utah State Board of Education data
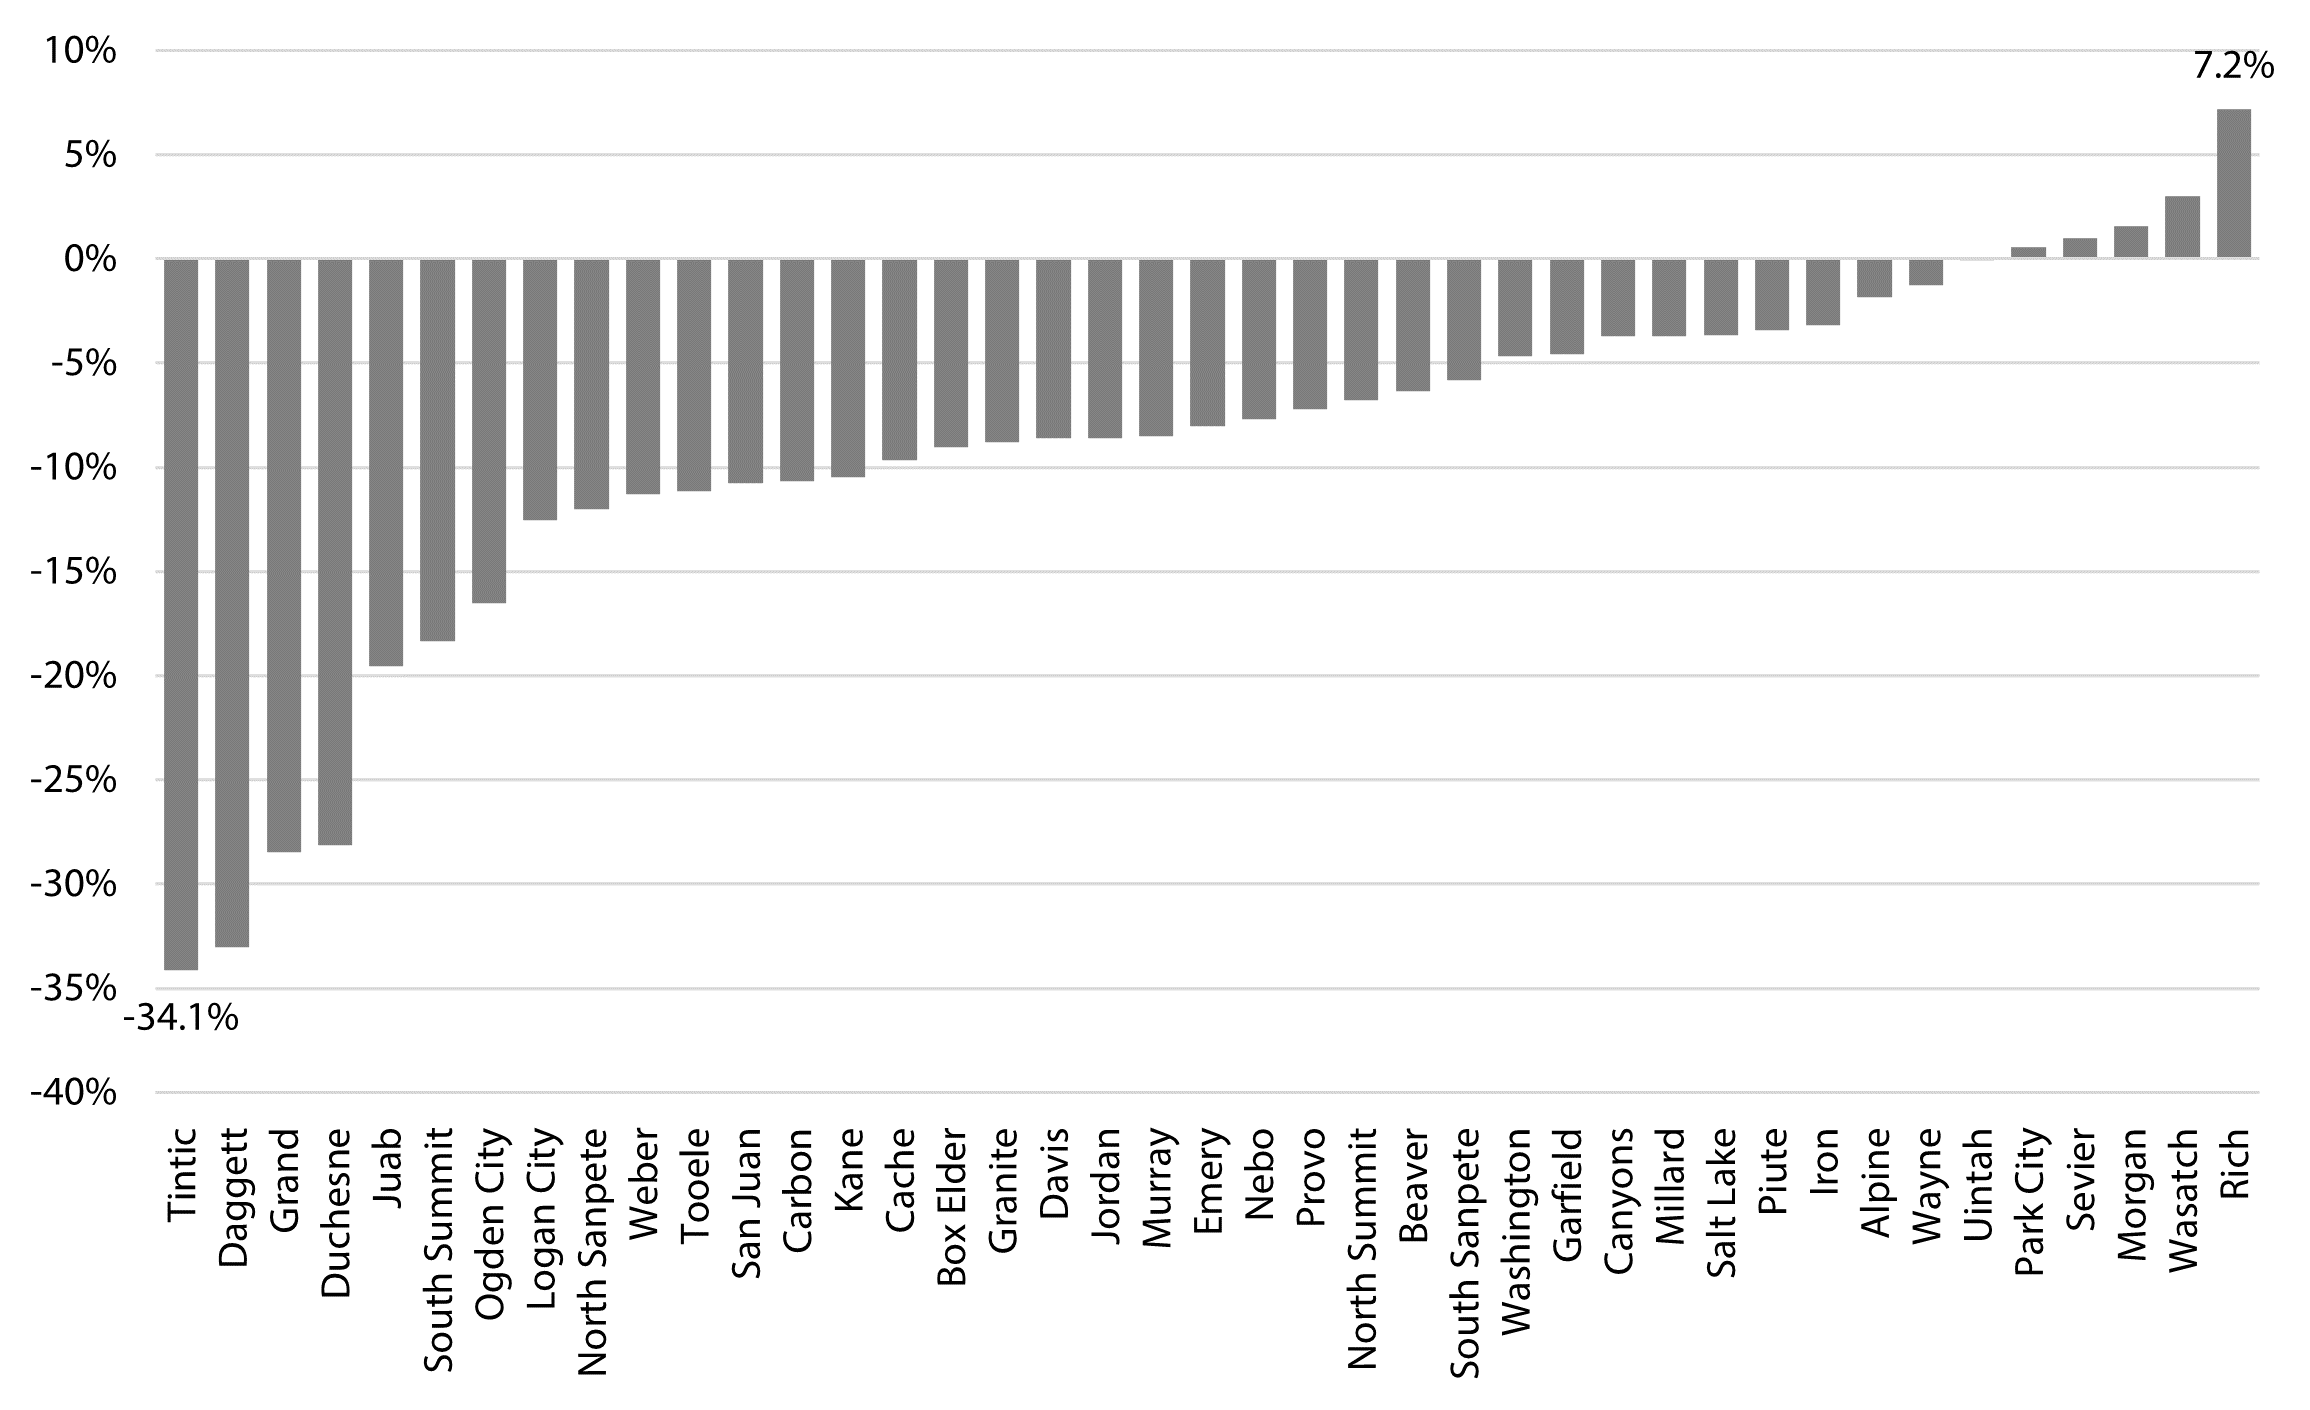
Learning loss differs across school districts as well. As an example, Figure 2 shows the average change in English language arts proficiency rates for grades 3-12 from 2019 to 2022. Rates of change range from a 34.1% decline in Tintic District to a 7.2% increase in Rich School District. Overall, 35 school districts saw declines in proficiency rates from 2019 to 2022 but five school districts (Morgan, Park City, Rich, Sevier, and Wasatch) saw improvement and one (Uintah) remained unchanged. Similar differences are seen across school districts in mathematics and science results.
Figure 2: Change in English Language Arts Proficiency Rates from 2019 to 2022
Note: Includes grades 3-12, the RISE test measures grades 3-8 and the ASPIRE test measures grades 9-12. Source: Kem C. Gardner Policy Institute analysis of Utah State Board of Education data
As we continue to work toward regaining lost learning and improving student outcomes, diving deeper into the data can help school and community leaders allocate resources and prioritize efforts. Understanding local impacts and unique circumstances can lead to more informed decisions as we seek solutions. Working together to understand students’ needs and finding effective ways to address them could lead to improved student outcomes in the short term and a stronger economy, flourishing community life, and a happier, healthier citizenry in the long-term.
Andrea Thomas Brandley is the senior education analyst at the Kem C. Gardner Policy Institute and a former teacher in Utah’s K-12 public schools.
[i] National Center for Education Statistics. National Assessment of Educational Progress. https://nces.ed.gov/nationsreportcard/


