
Blog Post
Insight: Utah County-level Race/Ethnicity Age and Sex Population Estimates, 2010-2018
By: Mike Hollingshaus
Today we publish our county estimates of race and ethnic populations by age and sex. This is a new product that expands our current suite of demographic estimates. It provides additional detail for seven race/ethnic groups for the 2010 to 2018 age and sex estimates that were published earlier this year. The release includes a full dataset and summary findings.
We found these estimates challenging to produce for two main reasons. First, there are many ways to measure race/ethnicity. Measurement categories change over time. And, what the categories actually mean to individual people is beyond our abilities to model. We used measurement categories consistent with the Office of Management and Budget definitions.
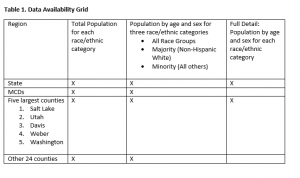
The second challenge was small population counts. Our explorations revealed estimates for a county’s race/ethnic group were reliable for populations larger than 720 people. Utah’s five largest counties approach this threshold: Salt Lake, Utah, Davis, Weber, and Washington. For these counties we could provide the full demographic detail for all seven race/ethnic groups. For the other counties, the population numbers were too small to get reliable statistical estimates; so we provide all the age and sex detail for “Majority” (non-Hispanic White alone) and “Minority” (all other race/ethnic groups). We further provide total population counts, and percentage distributions, for all seven groups for every county.
The Census Bureau publishes population estimates, but our estimates add additional detail. Whereas the Census Bureau releases data in five-year age categories, we release them in single years. This is especially important for college counties, where ages 18 through 24 are necessary. We also provide additional data to study Utah’s aging population by including age detail all the way to 100. We are able to incorporate better data and local expertise into our work, because we only produce these estimates for Utah. Our numbers are consistent with Utah Population Committee numbers, which Utah code requires for local planning.
These latest race/ethnicity estimates are available to businesses, schools, and other institutions as they adapt to Utah’s increasingly diverse population. For example, the Utah System of Higher Education recently used our state-level race/ethnic projections as part of their work estimating college education gaps. We hope these county level estimates can accomplish similar objectives for smaller geographies. Ultimately, we strive to provide policy-makers with good data, and look forward to continuing our efforts in the future.
Mike Hollingshaus is a demographer at the Kem C. Gardner Policy Institute.


