
Blog Post
Insight: Utah’s Migrants Changed (a little) During the COVID-19 Pandemic
By: Emily Harris
Note: The opinions expressed are those of the author alone and do not reflect an institutional position of the Gardner Institute. We hope the opinions shared contribute to the marketplace of ideas and help people as they formulate their own INFORMED DECISIONS™.
Jun 29, 2023 – Researchers and journalists have been diving into the most recent ACS data (2021) to start answering the question people have been asking since 2020: how is the pandemic impacting our society’s trends and behaviors? Emily Badger from the New York Times has been highlighting migration-related insights at the national level, looking at how education levels and telecommuting impacted intrastate movement during the pandemic.
But at the Gardner Institute, we share Utah-specific insights into these large, national datasets. This new factsheet compares 2021 migration data to a previous report on 2014-2018 migrant characteristics, provides a new profile on Utah’s migrants, and highlights meaningful differences that have occurred in Utah’s migrant population since the 2014-2018 period.
So, what do Utah’s migrants in 2021 look like?
Utah’s migrants in 2021 are not too dissimilar from the migrants in 2018. Between 25-30% of both in and out-migrants were born in Utah, either returning to or leaving their home state. Utah maintains western geographic migration ties, with most migrants coming from or going to California, Arizona, Idaho, Colorado, and Florida. Utah’s migrants are more racially and ethnically diverse and younger than Utah residents who did not move outside the state.
Figure 1: Utah Resident Population by Migration Status and Domestic Out-Migrants, 2021
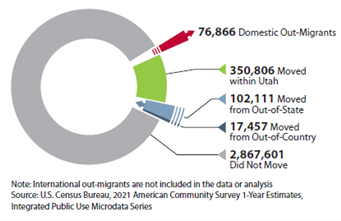
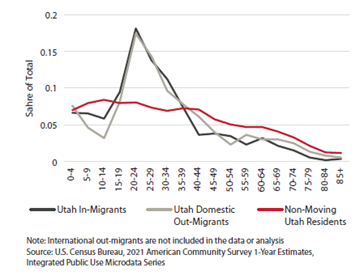
Figure 2: Age Distribution by Mobility Status, 2021
In 2021, Utah in-migrants and domestic out-migrants (ages 25 and older) were likelier to have a bachelor’s degree or higher than non-moving Utah residents. And lastly, in and out-migrants are much less likely to be homeowners than Utah’s non-moving population.
But what has changed since 2018?
- The individual in and out-flows of migrants decreased in 2021 compared to 2018 levels, but the difference between these two flows widened, leading to more net migration in Utah than pre-pandemic levels.
- The share of those that did not move in the last year increased from 83.3% to 85.9%
- A larger share of out-migrants moved to Arizona and Texas than in 2018.
- A larger share of in-migrants identified as Two or More races than in 2018.
- The out-migrant age structure shifted. Previous data showed 25-29 as the peak ages of out-migrants, whereas the newest data shows that the peak out-migrant age group is now 20-24.
- Both in-migrants and out-migrants are less likely to be attending school in 2021 than in 2018, indicating more labor-related movement than before.
- Additionally, out-migrants are less likely to be attending K-12 schools, meaning less family out-migration.
- Utah’s out-migrants are much more likely to be homeowners than in 2018. In 2021, 45% of out-migrants were homeowners in their new state compared to 36% in 2018.
It’s important to remember that 2021 data represents timing when uncertainties from COVID-19 were still very present. Once released, 2022 and 2023 data will provide more insights into whether the pandemic patterns persist or if migration trends will return to pre-pandemic patterns. Stay tuned!
Emily Harris is a Senior Demographer at the Kem C. Gardner Policy Institute.


