
Blog Post
Insight: Utah’s 2020 Fertility Update: How Low Can it Go?

By: Emily Harris
Mar 10, 2022 – The Gardner Institute is currently in the middle of its own little “baby boom.” With four babies born or expected from January through this coming April, it sure doesn’t feel like fertility is declining. However, the latest report on 2020 fertility trends indicates another year of declining fertility rates.
The CDC recently released the official 2020 births report, which provides valuable information for geographic comparisons, including updated state-level total fertility rates (TFRs) and age-specific fertility rates (ASFRs) for all 50 states, Washington D.C., and the nation.
See our previous fertility factsheet for more in-depth information on fertility rates and their definitions.
Utah’s 2020 TFR is 1.92, much higher than the national 2020 TFR of 1.64. Over the last year, Utah and the U.S.’s TFRs declined by the same amount (by 0.7). I note this seemingly unimportant fact because Utah’s TFR has been falling faster than the U.S. since 2009, and this could signal that Utah’s TFR is beginning to stabilize.
State TFRS, 2010-2020
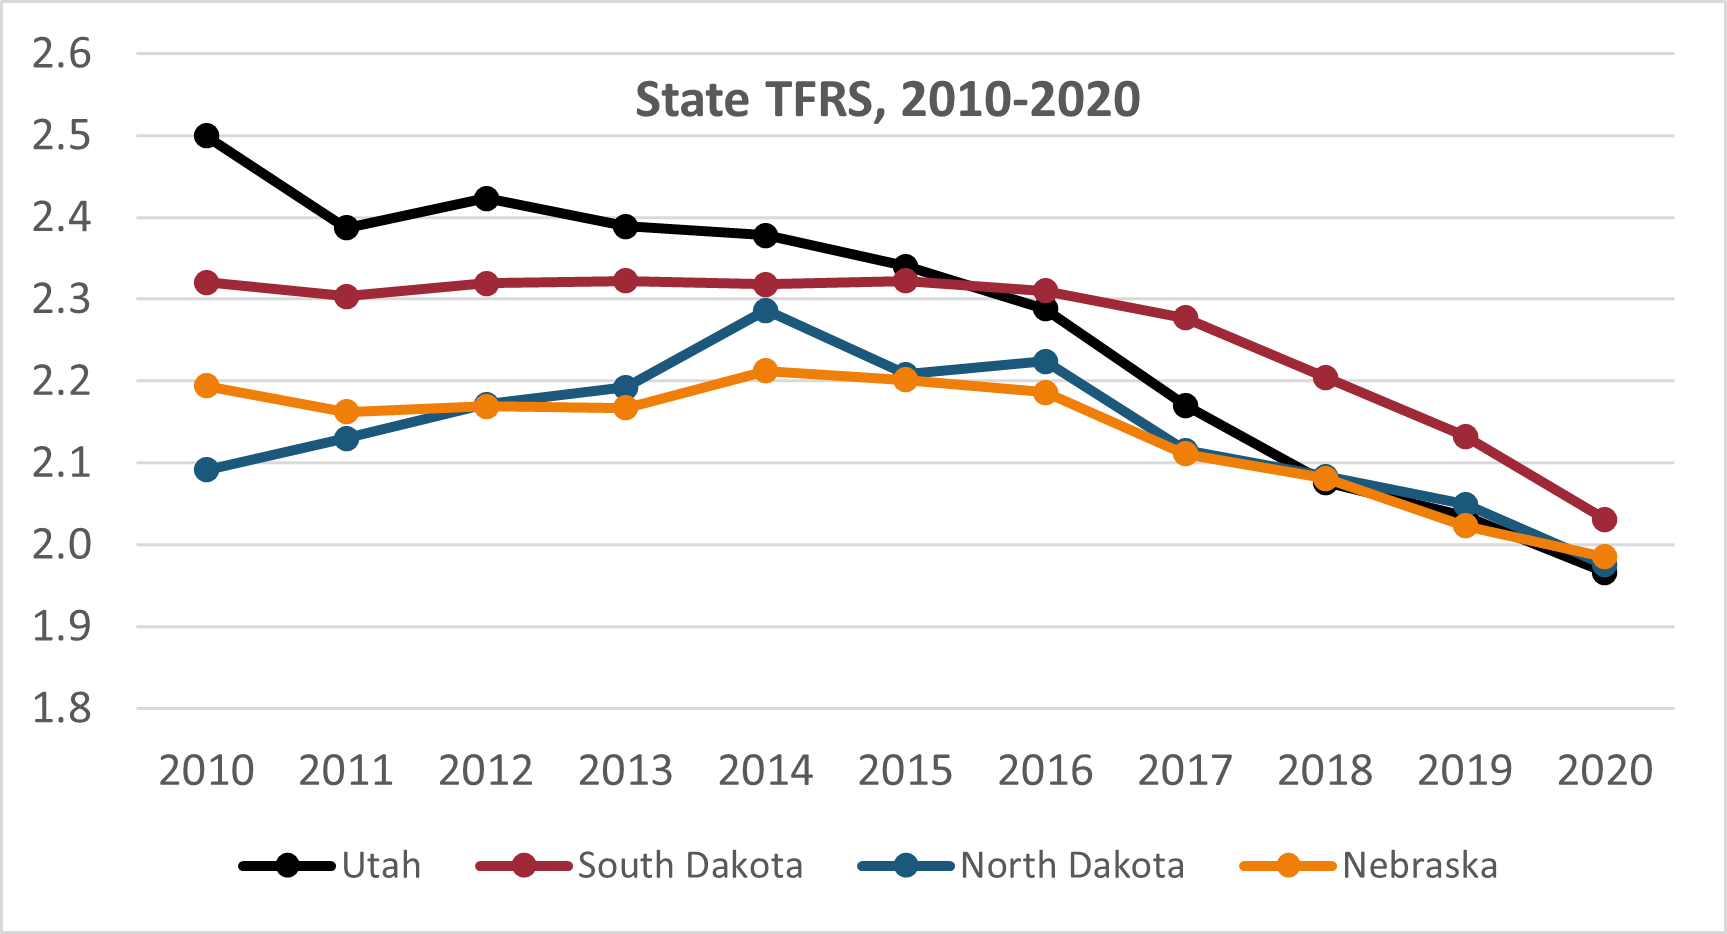
Source: National Center for Health Statistics
The 2020 numbers indicate that Utah’s TFR now ranks 4th highest in the nation, below South Dakota, North Dakota, and Nebraska. Until 2016, Utah consistently had the highest TFR in the country. Between 2016 and 2018, Utah’s TFR sharply declined, and since 2018 Utah’s TFR continues to decline but at a slower rate.
The graph below highlights the annual percent change of each state’s TFR over the last decade. Of the 11 years of data, you’ll notice that Utah has the highest percentage decline in over half of those years. And over the entire decade, Utah’s TFR decreased by 22%, almost twice as high as the next highest state, South Dakota, at a decline of 13%.
Annual Percent Change in State-level TFRS, 2010-2020
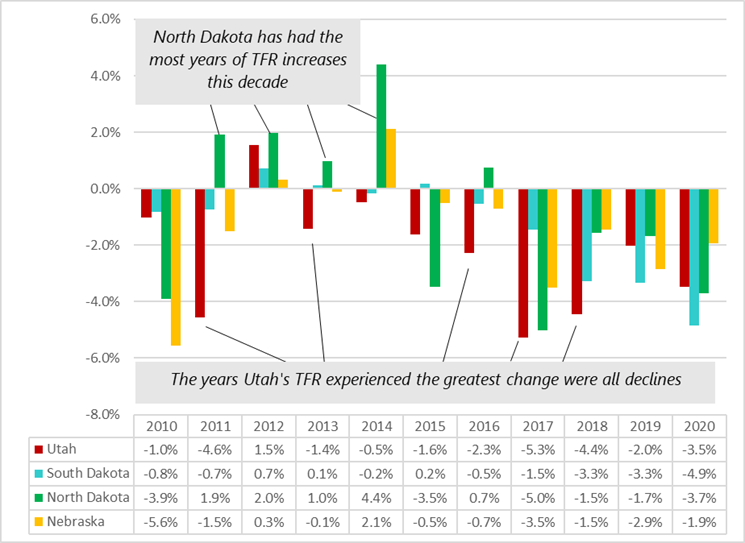
Source: National Center for Health Statistics
Total fertility rates are revealing, but if we break these TFRs down by age, we can understand what drives these total differences (the TFR is the sum of the ASFRs). A few things stand out in the age-specific chart below:
- Utah and South Dakota have a similar shape/pattern in their ASFRs: a peak in ages 25-29 and a decline in older age groups.
- North Dakota and Nebraska have a similar shape/pattern in their ASFRs: a high plateau in ages 25-29 and 30-34, meaning births are spread out more evenly across age groups than Utah and South Dakota.
- Of the four states in this chart, Utah has the lowest ASFRs for 15-19-year-olds and 30-34-year-olds.
2020 Age Specific Fertility Rates by State
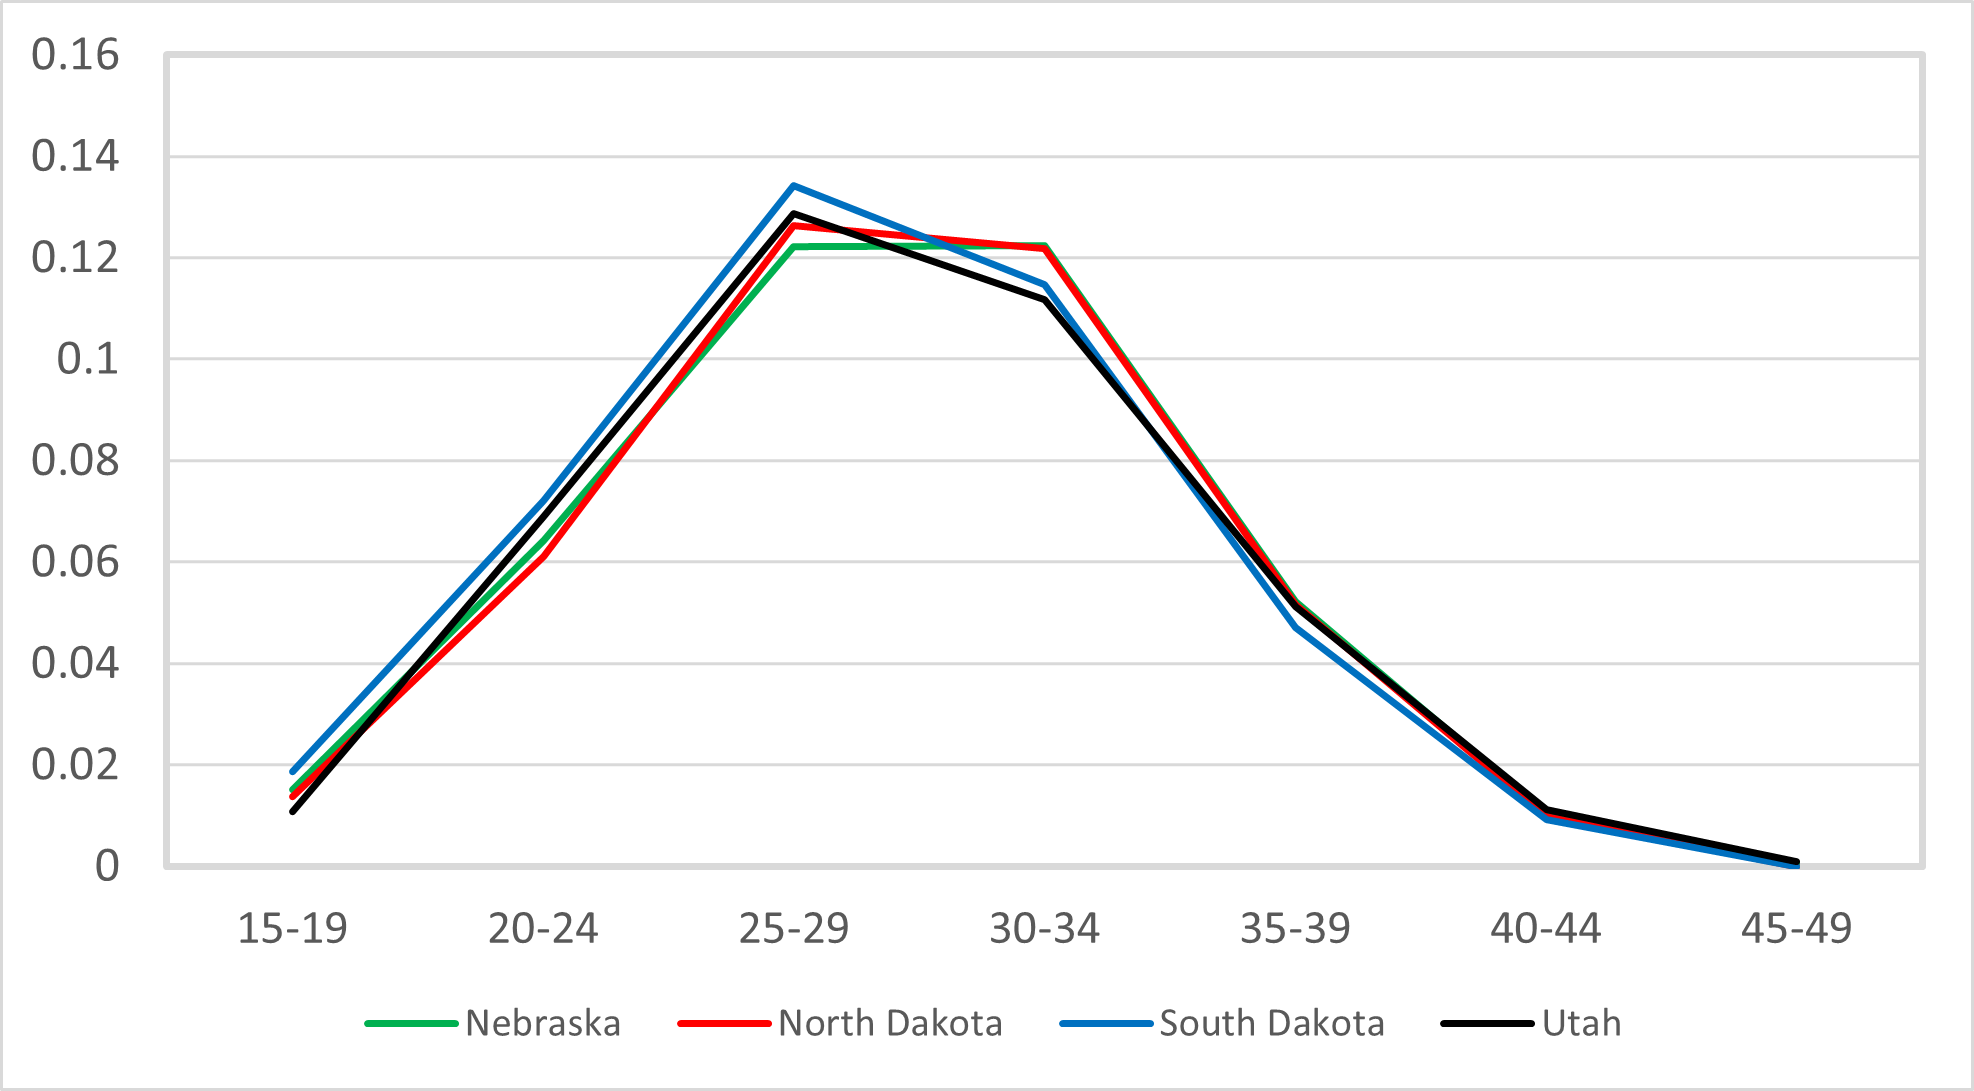
Source: National Center for Health Statistics
While it is no surprise to this demographer that Utah’s fertility rate declined again, it seems that Utah’s decline is starting to ease. Does that mean that Utah’s TFR will level off and maybe even increase again? No one really knows, but it is certainly possible, given Utah’s past trends of declining and increasing TFRs.
But my main question is: How low can it go?
Emily Harris is a senior demographer at the Kem C. Gardner Policy Institute.


