
Blog Post
Insight: How do the new U.S. Population Projections Compare to Utah’s?
By: Mike Hollingshaus
Nov 9, 2023 – The U.S. Census Bureau recently published new long-term population projections for the United States to 2100, along with scenarios. The Kem C. Gardner Policy Institute publishes population projections for Utah and its 29 counties. Our most recent baseline long-term planning projections and to 2060 were published last year.
This blog overviews some key top-level comparisons between the Utah and United States population projections until 2060. Though the projection models use different methodologies appropriate to their geographies (the United States uses international migration rates, while Utah uses employment growth), these comparisons illuminate how Utah fits into the larger picture of national growth.
Total Population
In 2022, the United States population was about 333 million. Utah’s population was around 3.4 million, about 1% of the U.S. total. Figure 1 shows the projected populations for both populations. Note that while the Census Bureau terms their most likely projection the “middle” scenario, we call it the “baseline.”
Fig. 1. Projected Population Scenarios, Utah and United States.
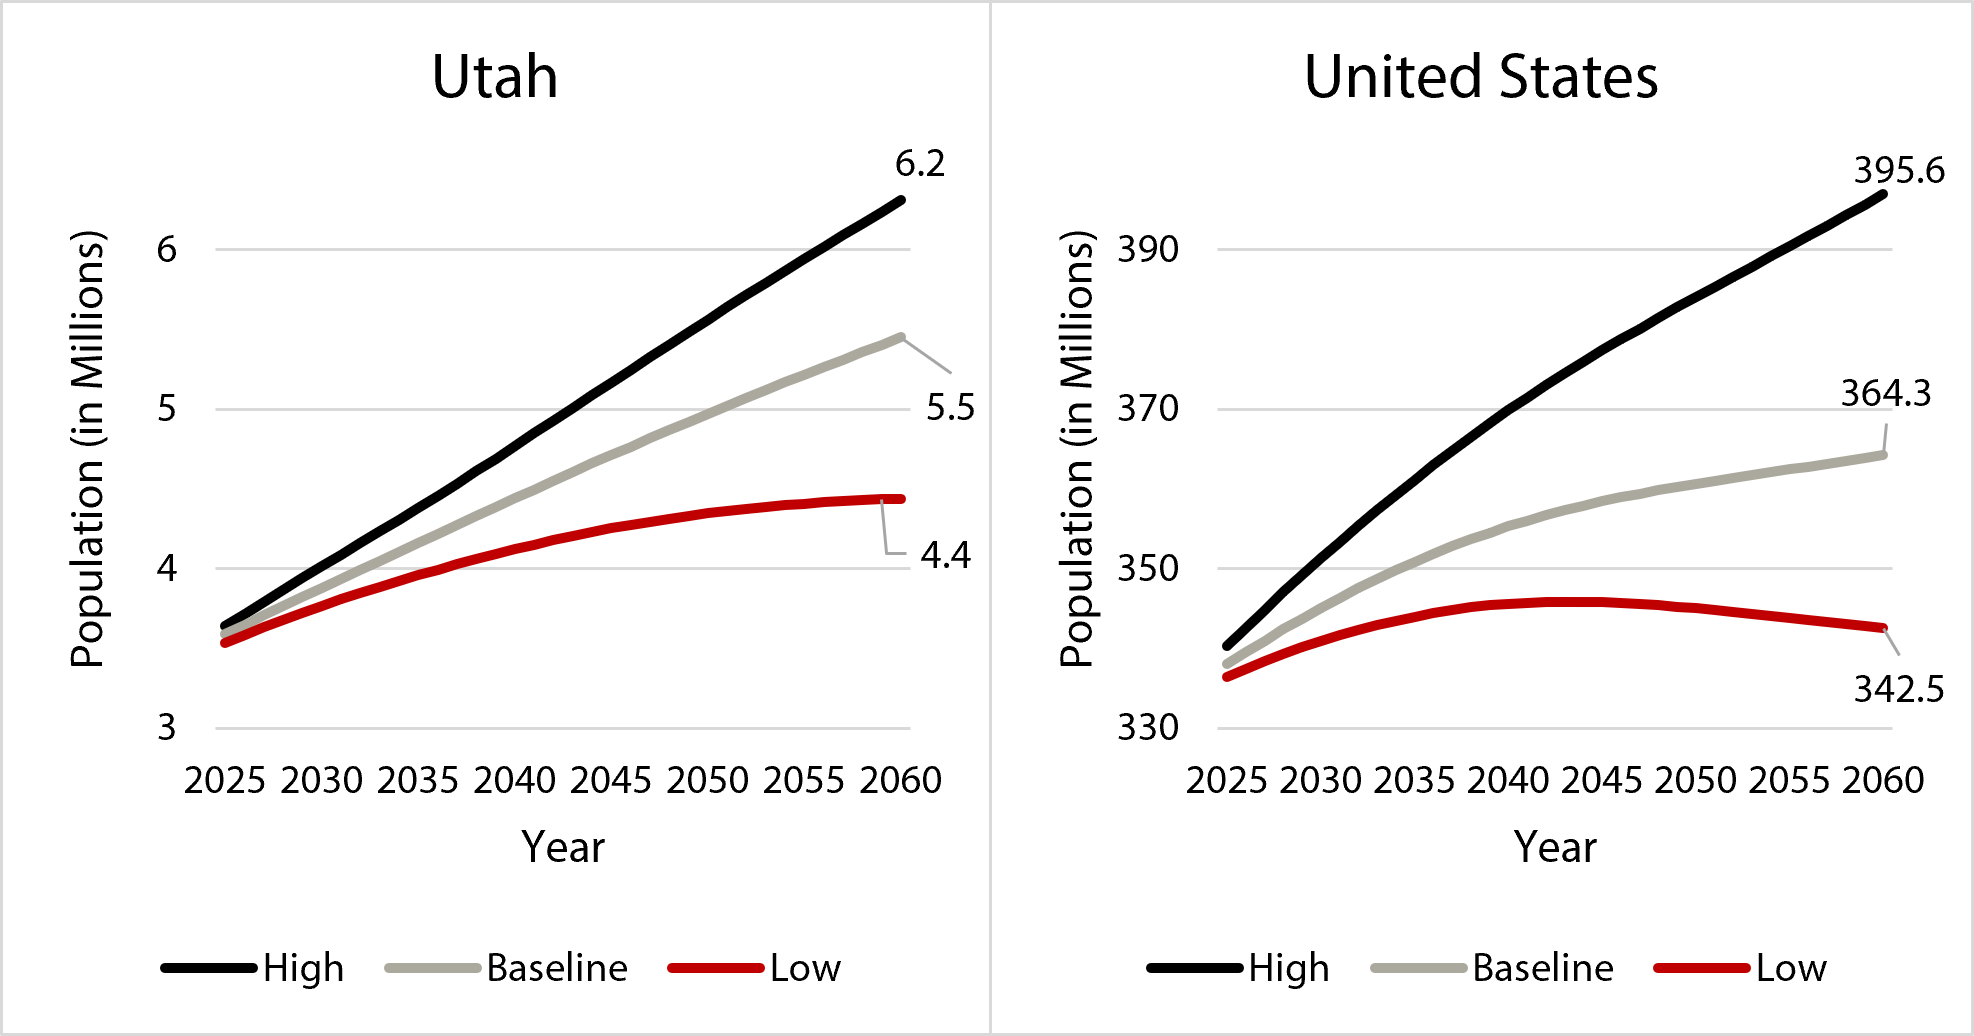
Source: Kem C. Gardner Policy Institute (Utah Series), U.S. Census Bureau (United States Series).
During this timeframe, both the U.S. and Utah populations are projected to increase. While Utah currently comprises about 1% of the U.S. population, it will comprise 1.5% by 2060 if these baseline projections are correct due to Utah’s above-average growth rates.
Growth Rates
Utah is projected to grow much faster than the United States between 2022-2060, at a 1.25% average annual percentage growth rate compared with 0.23% nationally. This continues a historical trend where Utah grew faster than any other state between 2010-2020 at 18.4% overall. During the same timeframe, the U.S. grew at its slowest rate since the Great Depression, at 7.4% overall.
Growth rates for the U.S. and Utah are both projected to decline, as shown in Figure 2, which follows the trends occurring over the past several decades. While not shown here, the United States population is projected to begin declining (a negative growth rate) around 2080. However, this is a long time away, and any number of events could change that course.
Fig 2. Projected Annual Percentage Growth Rates, Utah and United States Baseline Scenarios.
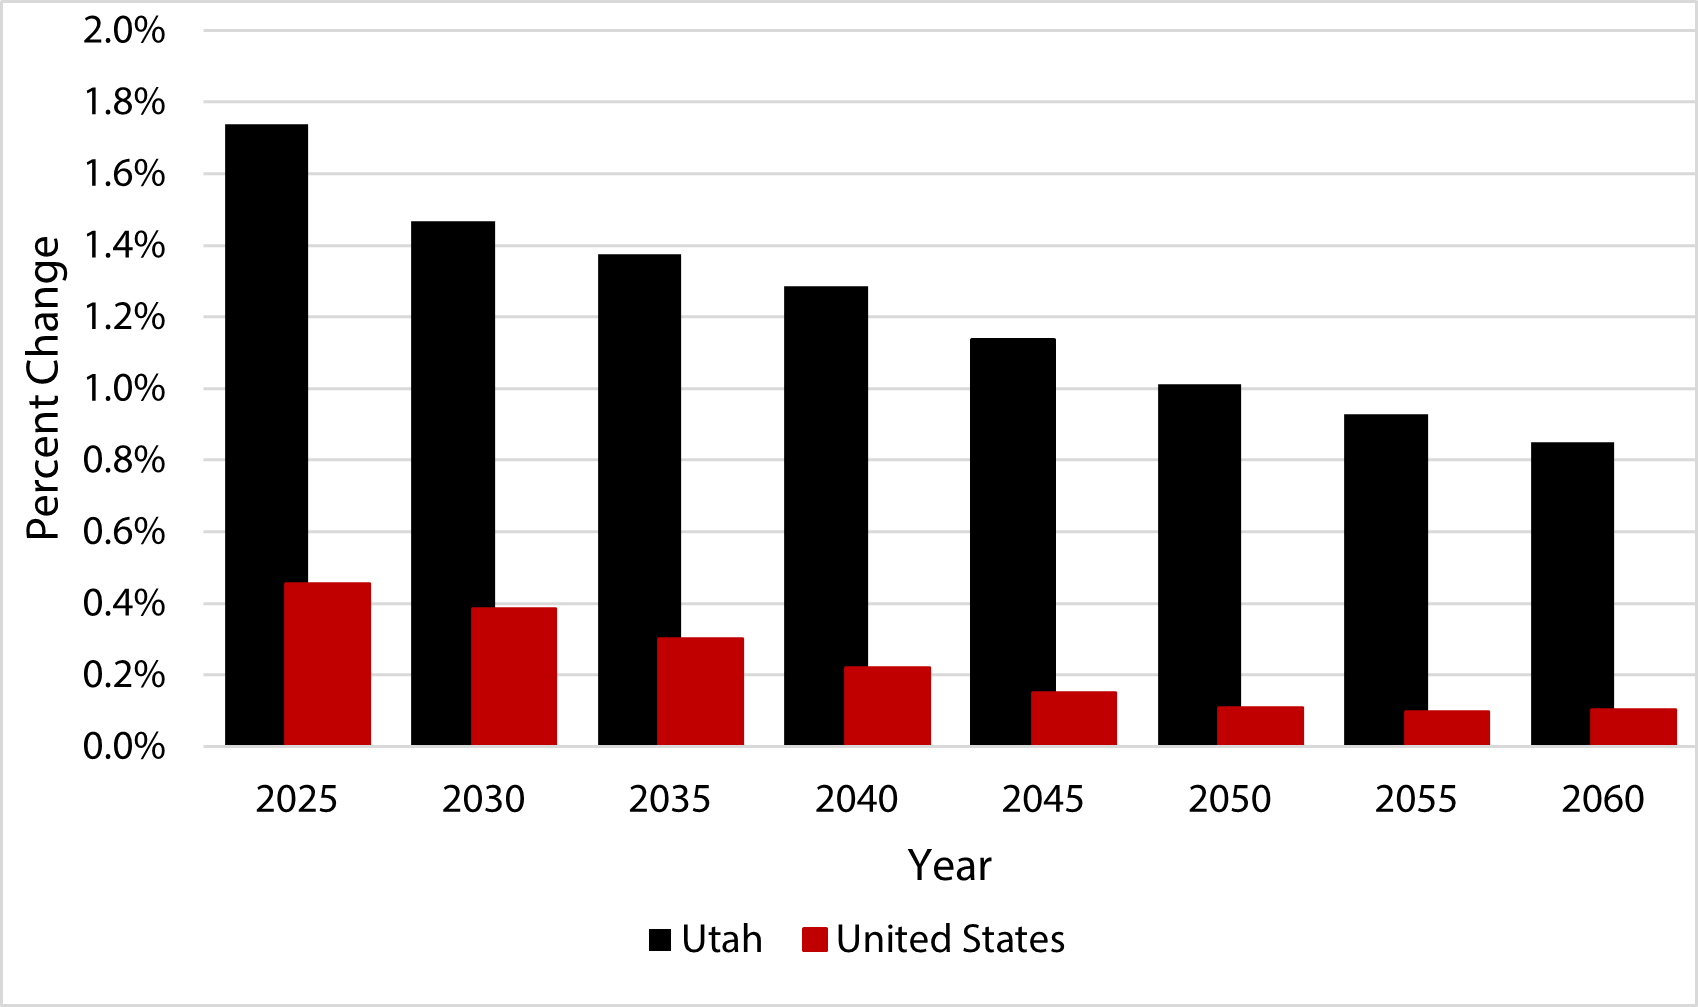
Source: Kem C. Gardner Policy Institute (Utah Series), U.S. Census Bureau (United States Series).
Components of Change
Utah is in a phase of high growth, primarily due to its combination of high economic growth, the nation’s youngest population, and higher-than-average fertility rates. Table 1 presents the natural increase (births minus deaths), net migration, and total population change each decade 2030-2060.
Table 1. Projected Components of Change, Utah and United States Baseline Scenarios.
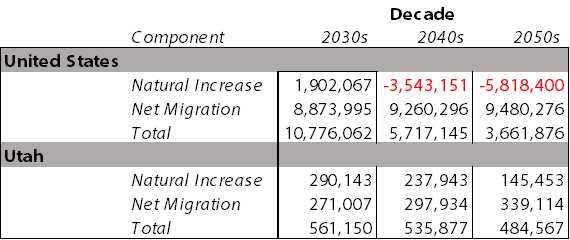
Source: Kem C. Gardner Policy Institute (Utah Series), U.S. Census Bureau (United States Series).
Table 1 shows how net migration is projected to become a more important contributor to population growth in both Utah and nationally. It is important to clarify that for the U.S., net migration comprises international migration, while Utah includes both international and domestic migration. In Utah, the projected net migration is closely tied to employment growth.
As net migration continues to increase each successive decade, natural increase declines. For the U.S., natural decrease (more deaths than births) is projected to begin around 2040. In contrast, Utah is unlikely to experience natural decrease before 2060. This can be attributed to higher fertility rates and a younger starting population. The total fertility rates for Utah and the United States in 2021 were 1.92 and 1.66, respectively, with Utah ranking 4th highest among the states.
Age Structure
Utah, like the rest of the U.S., is aging. Between 2010 and 2020, Utah’s population aged 65 and older grew by 53.0% compared to its total population growth of 18.4%, while the U.S. population aged 65 and older grew by 38.6%. These rapid growth rates are largely due to a history of decreasing birth rates, rising life expectancies, and Baby Boomers aging into retirement years.
But Utah is still relatively young. In 2022, Utah had the country’s youngest median age at 31.9—seven years less than the U.S. value of 38.9. Figure 3 shows how the median ages are projected to increase over time.
Fig 3. Projected Median Age, Utah and United States Baseline Scenarios.
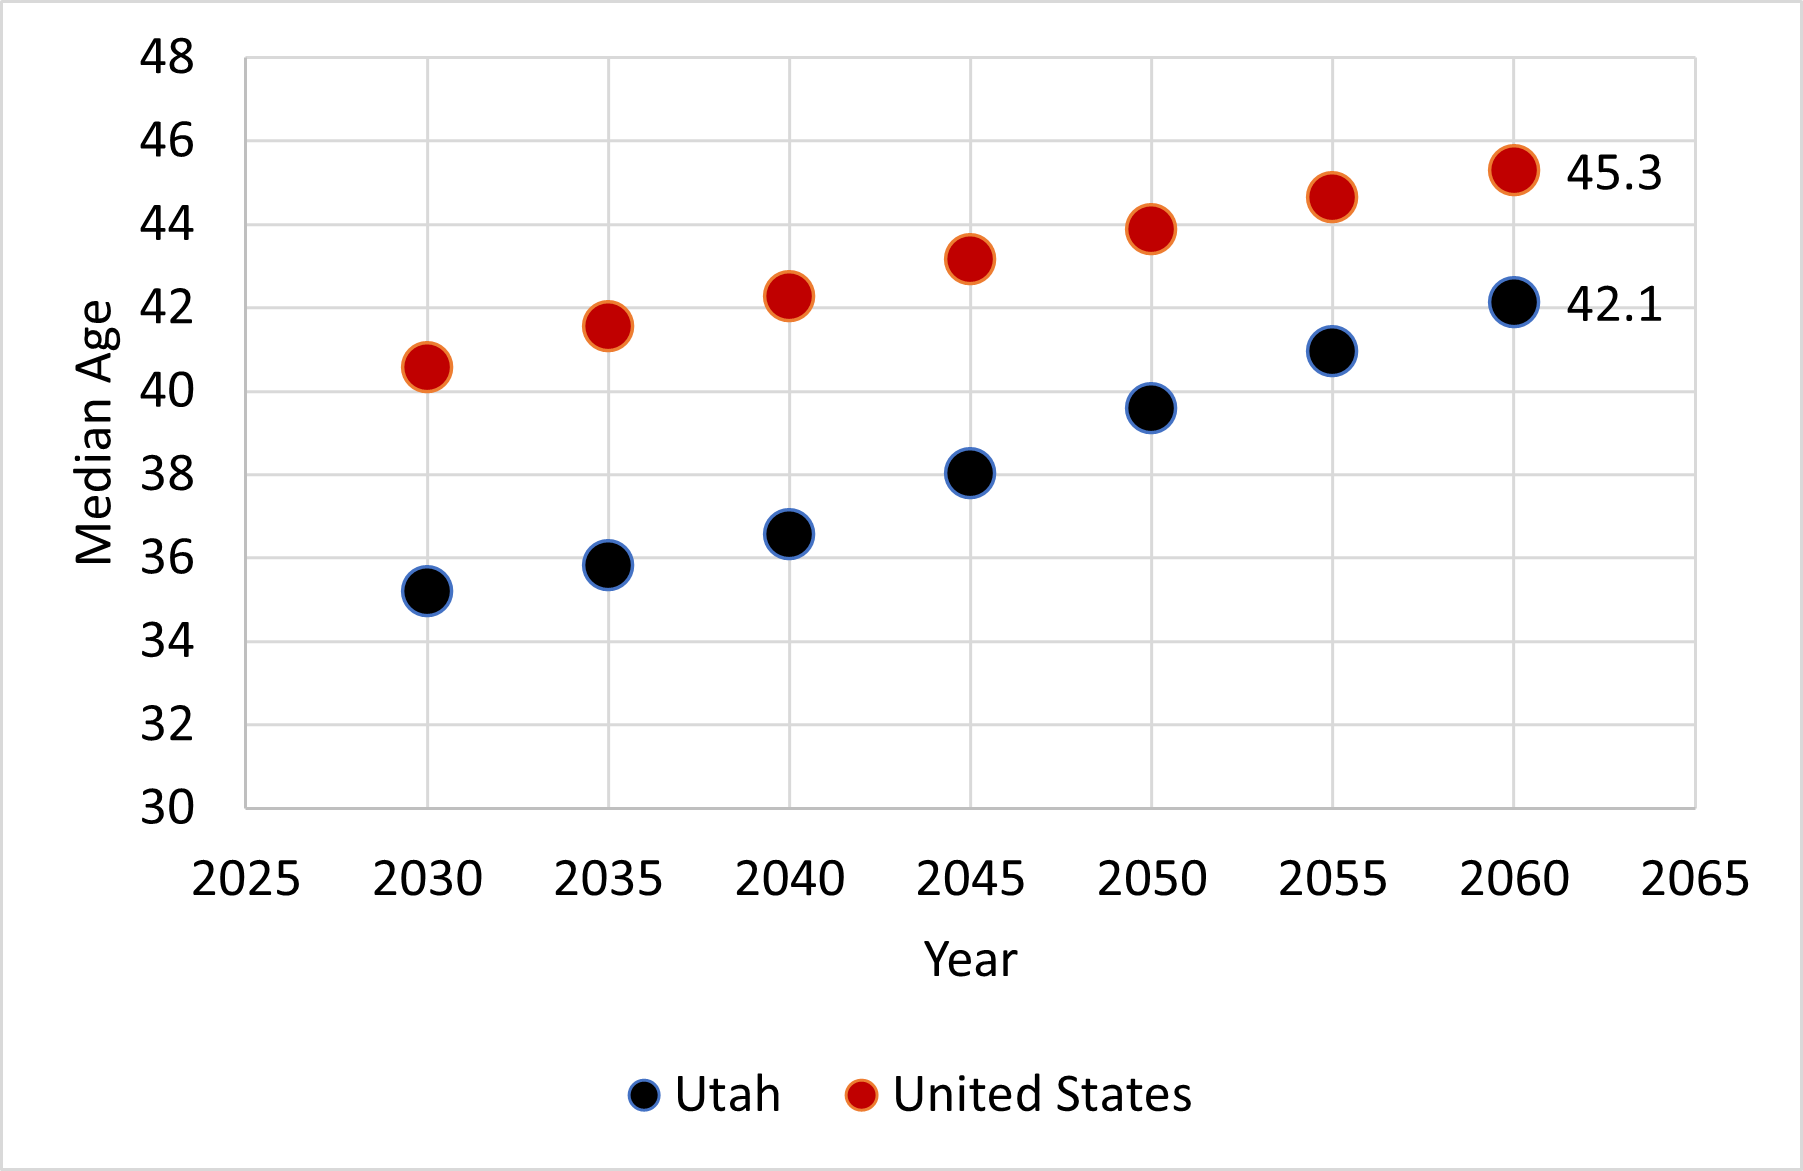
Source: Kem C. Gardner Policy Institute (Utah Series), U.S. Census Bureau (United States Series).
The gap is expected to close over time, with the U.S. and Utah median ages for 2060 projected to be 45.3 and 42.1—a difference of about 3 years. This closing gap is largely due to Utah’s fertility rate becoming more like the nation’s. Utah’s total fertility rate has rapidly dropped over the past decade, and the Gardner Institute projections assume that rate will continue to become more like the nation going into the future.
Race and Ethnicity
Also like the nation, Utahns are continuing to become racially and ethnically diverse. The Census Bureau measures racial and ethnic diversity using the Diversity Index (DI), which ranges from 0% (least diverse) to 100% (most diverse). In 2020, the U.S. had a DI of 61.1%, while Utah’s DI was 40.7%.
Table 2 shows the share of the population in the U.S. and Utah that are projected to be racial or ethnic minorities (Hispanic or nonwhite). The Utah shares are from a different Gardner Institute race and ethnic projections, which we plan to update when the necessary data are available.
Table 2. Projected Minority Share of Population, Utah and United States Baseline Scenarios.
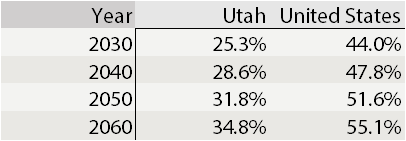
Source: Kem C. Gardner Policy Institute (Utah Series), U.S. Census Bureau (United States Series).
The share of residents that identify as racial or ethnic minorities is projected to increase from 44.0% to 55.1% in the United States and from 25.3% to 34.8% in Utah between 2030 and 2060.
Conclusion
Both Utah and the United States are projected to continue growing into the future. While both populations are likely to grow at slower rates over time, Utah is growing much faster. This is largely due to a historically higher fertility rate, young population, and rapidly growing economy. Both populations are projected to age, with important implications for future demographic, economic, and social systems. Additionally, Utah and the U.S. will continue to become more racially and ethnically diverse. The Gardner Institute produces and regularly updates population projections for Utah and its counties to guide state and local planning efforts.
Mike Hollingshaus is a senior demographer at the Kem C. Gardner Policy Institute.
Note: The opinions expressed are those of the author alone and do not reflect an institutional position of the Gardner Institute. We hope the views shared contribute to the marketplace of ideas and help people as they formulate their own INFORMED DECISIONS™.


