Blog Post
Insight: Getting to Know the New Ivory-Boyer Construction Database

By: DJ Benway
On May 1st, the Kem C. Gardner Policy Institute officially launched a modernized interface for the Ivory-Boyer Construction Database.
For those unfamiliar with the Ivory-Boyer Construction Database, the Gardner Institute, in partnership with the Ivory-Boyer Real Estate Center, tracks building permit activity in Utah. The Gardner Institute collects and maintains monthly building permit data for 201 cities and 29 counties across the state. The database includes historical permit data back to 1994 and covers 27 data categories: nine for Dwelling Units, 16 for Non-Dwelling Unit Construction, and two for Additions, Alterations, & Repairs.
The home page summarizes the latest data available with four visualizations (Figure 1). These graphs provide a quick snapshot of key indicators of statewide construction activity for the year. This page serves as a quick reference for economists, industry professionals, and journalists to access up-to-date information on the current state of the construction industry.
To dig deeper into the data, click through to one of the three provided links, all of which are also located on the home page:
–Monthly Data: Provides easy access for any month-to-month, quarterly, or other unique monthly combination to explore historical trends.
–Year-to-date Data: Share year-to-date statistics up to the latest month of data for the current year. This page is a great way to compare the current state of Utah’s construction activity to previous years.
–Custom Date Range allows for any continuous date range. This page is the easiest way to calculate year-end totals.
There is a learning curve for the interface, and new tips and tricks are discovered regularly. One helpful example is the ability to expand and collapse date columns. To do this, hover over a date column till either a “+” or “-“ appears. Click this button and the column either aggregates the data up (e.g. months to years) or expands the data out (e.g. years to months). An example is shown in Figure 2.
The database accesses the same historical data as the previous version and is regularly updated to provide the most accurate up-to-date statistics. This modernized approach adds a lot of functionality and allows users the ability to copy images, download raw data, and export cross tabulations.
Figure 1: Ivory-Boyer Construction Database Indicators, March 2019*
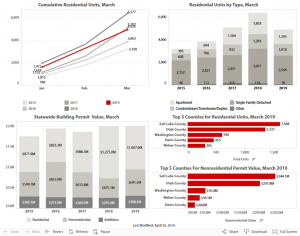
Figure 2: Ivory-Boyer Construction Database Date Aggregation Example*
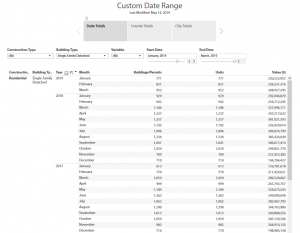

*Source: Ivory-Boyer Construction Database
DJ Benway is a research analyst at the Kem C. Gardner Policy Institute.