Blog Post
Insight: Economic Development Needs Better Questions
By: Max Backlund
Note: The opinions expressed are those of the author alone and do not reflect an institutional position of the Gardner Institute. We hope the opinions shared contribute to the marketplace of ideas and help people as they formulate their own INFORMED DECISIONS™.
Mar 12, 2021 – When you read economic development strategies for fun you are rarely asked to dinner parties. I have been reading strategies for years now and can count on one finger the number of dinner parties I’ve been invited to. My years of reading strategic plans started at the Economic Development Corporation of Utah, where I worked to help communities with the competitive nature of the site selection process. Company decision-makers are typically data-driven as they consider potential sites, and communities must speak their language to remain competitive. After reading hundreds of strategic plans from across the state, I have one initial recommendation to help communities improve their strategic planning: engage with the data.
I use three key words to engage with data: velocity, direction, and context. Mike Flynn, the COO of EDCUtah, taught them to me, and now I share them here. These three words provide an essential guide to analyzing and communicating data. Velocity and direction provide insight into the factor of time, while context deals with geography. For example, a common mistake that economic developers make is to list a number in their strategic plan, like a 3% employment growth rate, without talking about the context for that number. Has your 3% growth rate increased or decreased year-over-year? Is your growth rate faster or slower than your neighbor counties? Where is employment growing in Utah? Where is it shrinking?
Velocity and direction are important because they unlock questions about the broader economic and demographic context. If you think of economic development as inherently competitive for job growth, then one example goal might be to address a community’s market share of employment. If we take employment growth as a proxy for business investment, then an increasing share of total state employment shows us where business investment is growing at an accelerated rate. We can use velocity and direction to help us examine the context for these growth centers.
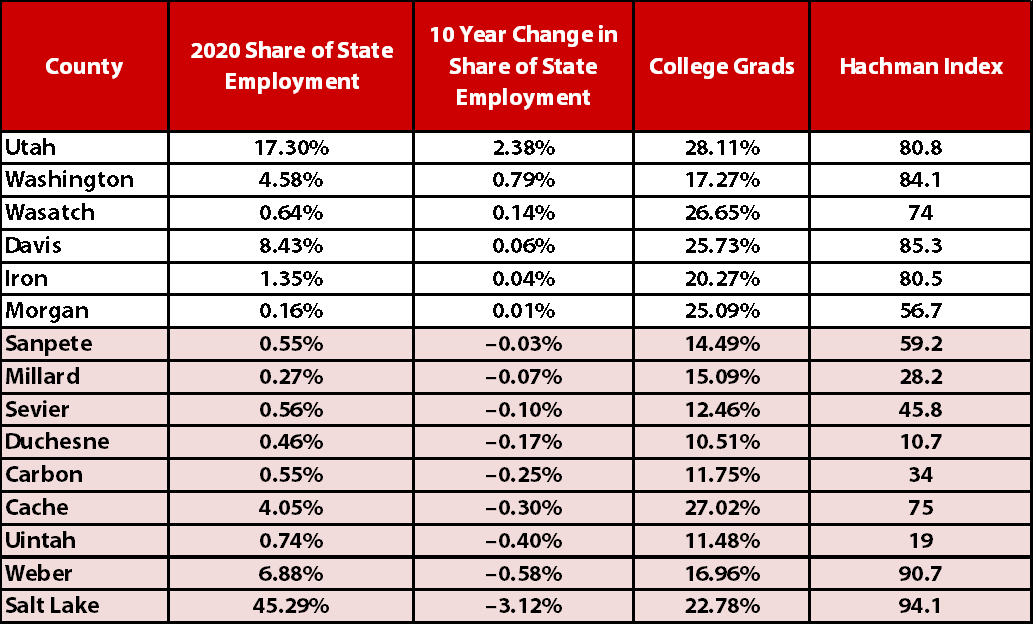
This chart shows the 10-year change in share of state employment by county for a selection of urban and rural population centers. Only six of Utah’s 29 counties grew their share between 2010 and 2020. This is not really surprising, given the math behind exponential growth and the concentration of Utah’s population in urban areas. Growth rates in these counties reflect how many company decision drivers strive to balance access and affordability—access to markets, real estate, workforce, and infrastructure, all while addressing operation costs and affordability. Smaller counties with increasing employment shares are located near urban centers, have high educational attainment rates, and greater economic diversity (measured by the Hachman Index).
Table 1: Change in Employment Market Share of Selected Utah Counties
Source: Utah Department of Workforce Services (employment and educational attainment), and Kem C. Gardner Policy Institute (employment analysis and Hachman Index)
An extra bit of context: you may notice that Salt Lake County falls near the bottom of this list. From 2010 to 2020, its share decreased from 48.4% of the state’s employment to 45.3%, a drop of just over 3 percentage points. Its next largest competitor for employment share is Utah County, which saw its share rise from 14.9% to 17.3%, an increase of about 2.4 percentage points. To accomplish that feat, Utah County added 98,202 jobs to Salt Lake County’s 144,542. Together, Utah and Salt Lake County added 242,744 of the 361,413 new jobs created from 2010 to 2020. That represents a remarkable 67% of job growth, or two out of every three jobs created in the state of Utah. Salt Lake County created more jobs per week (277) than Millard County created in 10 years (231).
Datasets like this one are useful guides to asking better questions about the role of economic development in the face of statewide economic and demographic trends. The Gardner Institute staff have expertise to help communities engage with data in meaningful ways.
While data analysis may not help you with dinner invites, it will help you invite greater economic development.
Max Backlund is a senior research associate at the Kem C. Gardner Policy Institute.


