Blog Post
Insight: Census Bureau Releases July 1, 2022 Age, Sex, and Race and Hispanic Origin Population Estimates
By: Emily Harris
Note: The opinions expressed are those of the author alone and do not reflect an institutional position of the Gardner Institute. We hope the opinions shared contribute to the marketplace of ideas and help people as they formulate their own INFORMED DECISIONS™.
Jun 22, 2023 – If you follow our demographic work at the Gardner Policy Institute lately, you may be overwhelmed with the sheer amount of Census Bureau data products being released. That’s ok, we are a bit overwhelmed, too. Between the typical population estimates release schedule and then the 2020 Demographic and Housing Characteristics release less than a month ago, there is a dizzying amount of detailed demographic information out there. It’s a good problem to have.
But this release wraps up the Census Bureau’s 2022 Vintage population estimates (different from the 2020 Decennial data), and provides age, sex, race and Hispanic origin detail at the national, state, and county levels. We have provided two Utah-specific fact sheets, one for Age and one for Race and Hispanic Origin.
In the July 1, 2022 estimates, Utah appeared in national headlines for:
- being the youngest state in the nation with a median age of 31.9 years;
- Utah and Cache counties were the youngest counties in the nation with over 100,000 residents;
- Utah County had the fastest growing Native Hawaiian and Other Pacific Islander population in the country at 5.6% (for counties with Native Hawaiian and Other Pacific Islander populations above 10,000).
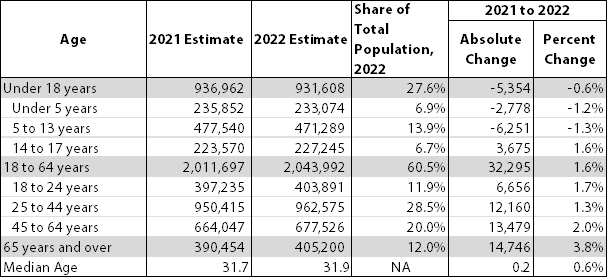
Utah may be young, but it follows the national trends of an aging population and decreasing fertility rates. The decreasing under 18 population and increasing population age 65 and over provide evidence of these changes at the state level.
Utah Population by Age Groups, 2021-2022

Note: Estimates are for July 1 of the given year
Source: U.S. Census Bureau, Population Division
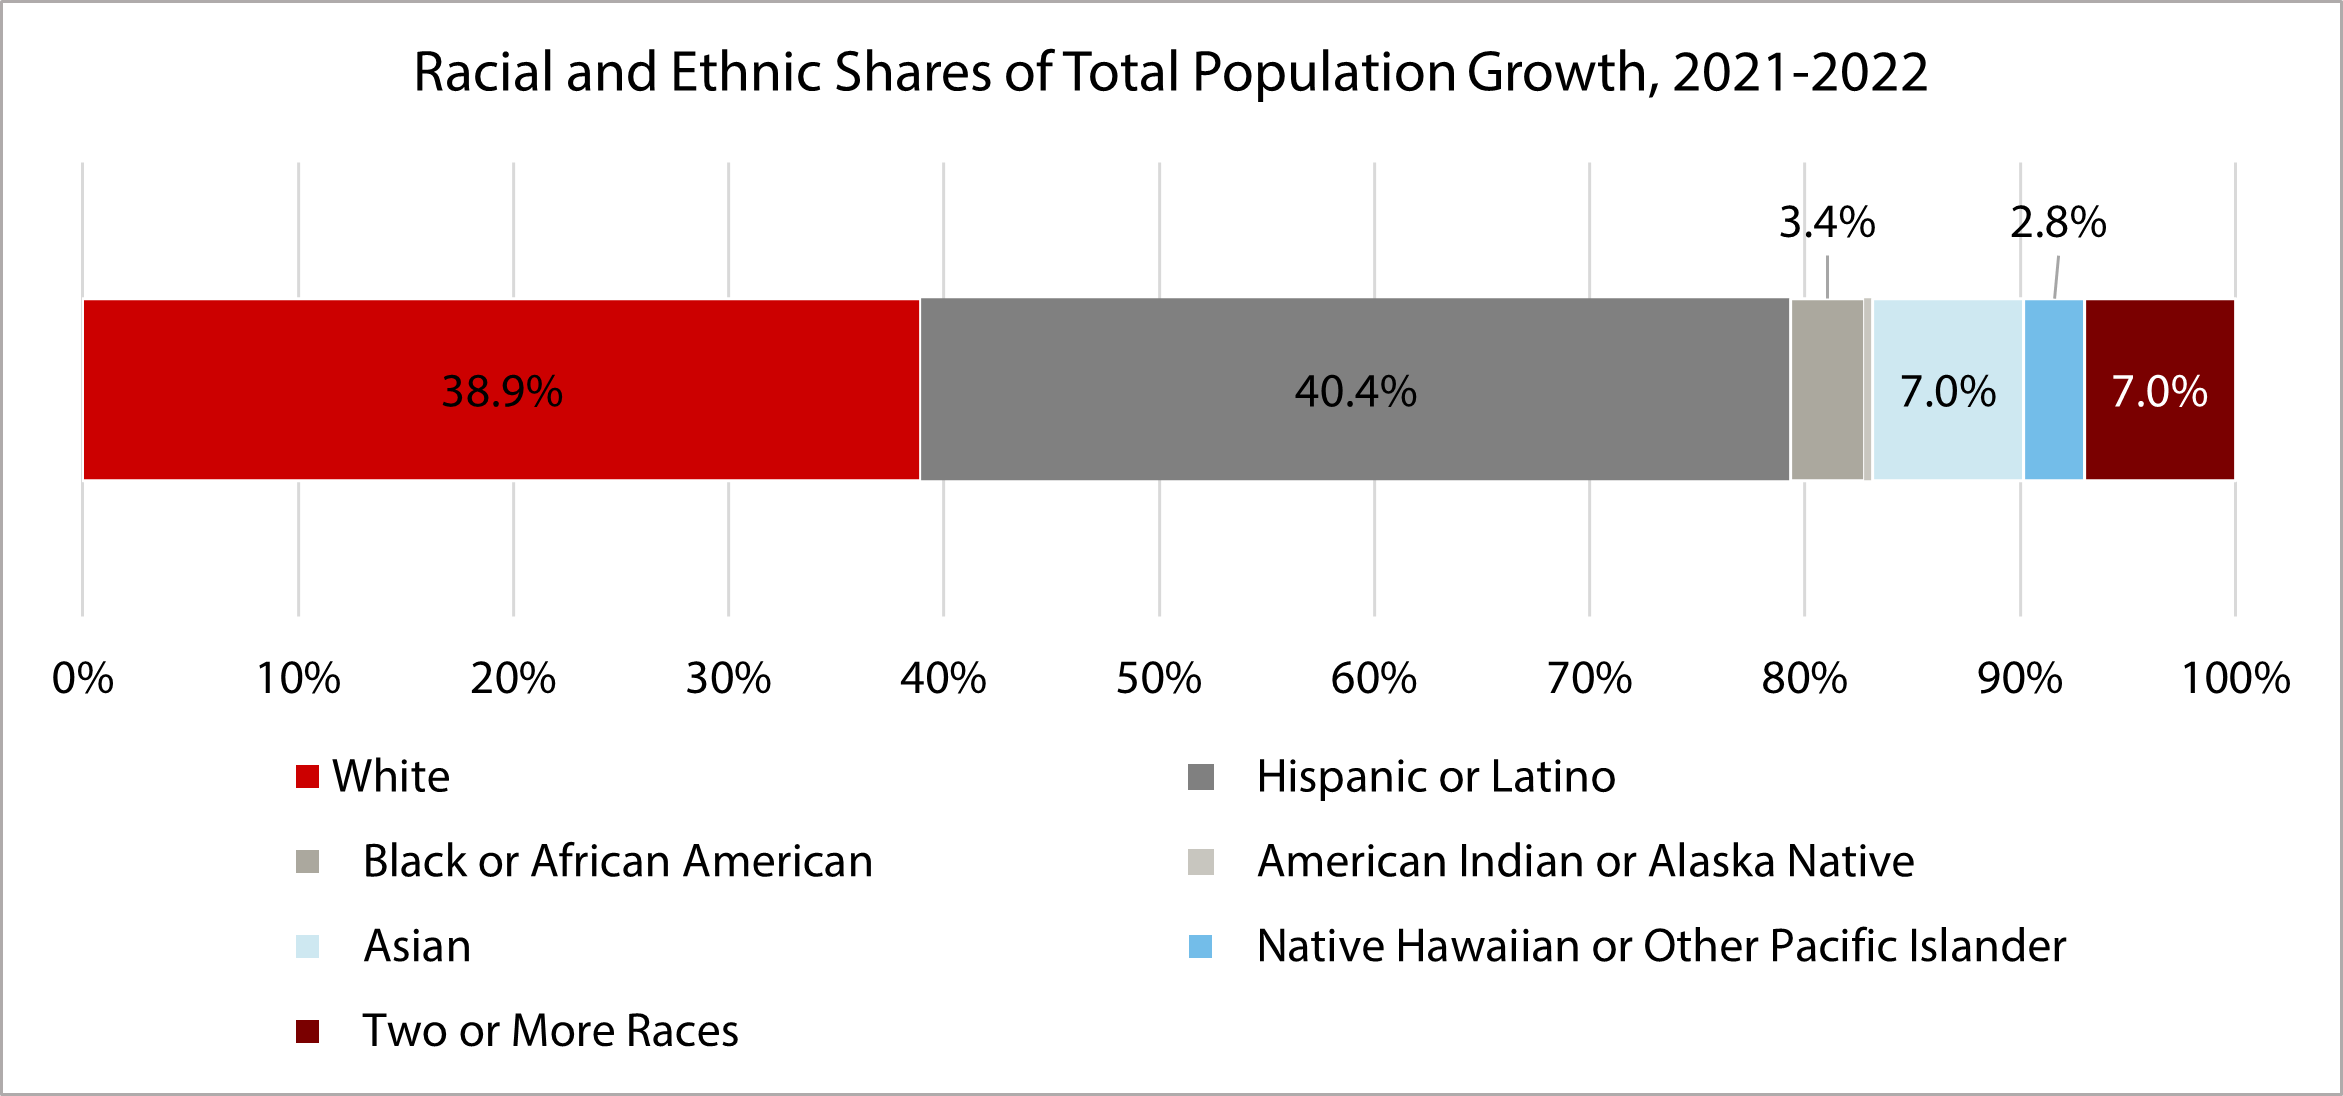
While Utah’s population is aging, it is also becoming more racially and ethnically diverse. The population estimates indicate that 23% of Utahns identify as racial and ethnic minorities (groups that represent less than 50% of the population), but accounted for 61% of Utah’s growth from 2021 to 2022. Additionally, the Hispanic or Latino population, Utah’s second-largest racial or ethnic population, crossed the half-million mark in 2022, and increased 3.4%, from 495,239 in 2021 to 512,087 in 2022.

Source: U.S. Census Bureau, Population Division
One caveat about this data: the age, sex, and racial and ethnic population estimates do not align with the age, sex, and racial and ethnic 2020 Decennial data due to various issues surrounding differential privacy protections, data delays, and methodology changes. For more information on these data discrepancies, please refer to the Census Bureau’s methodology statement.
Emily Harris is a senior demographer at the Kem C. Gardner Policy Institute.
