Blog Post
Insight: 2018 Hispanic Heritage
By: Mallory Bateman
Hispanic Heritage month runs from September 15th to October 15th. To celebrate, here are a few data points about Utah’s Hispanic or Latino population from the latest release from the American Community Survey. The Census Bureau definition of Hispanic or Latino origin includes people whose origins are from Spanish-speaking regions. With over 434,000 individuals or 14 percent of the total state population in 2017, Utah’s Hispanic or Latino population is the largest minority group.
Nationally, there were almost 59 million people who identify as Hispanic or Latino. This equates to 18 percent of the total U.S. population. Utah’s share of Hispanic or Latino population is 13th largest in the nation. New Mexico holds the number one spot, with 49 percent of the population identifying as Hispanic or Latino. California has the largest overall population of Hispanic or Latino residents, with over 15 million.[1] More information about the nation as a whole can be found here.
Salt Lake County has the largest Hispanic or Latino population of any county, with over 200,000 people or 18 percent of the population. West Valley City has the largest Hispanic or Latino population, at 49,680 people or 36 percent of the city population.[2] This population plays a significant role in West Valley’s shift to a minority-majority populated city.
The state’s Hispanic or Latino population is not a monolithic group. One way to understand the diversity is to look at regions of origin, including Mexico, Latin America, Central America, and those who identify with Spain or other areas. Of this population, the majority (72 percent) identified as Mexican. South American made up 8 percent and Central American was 7 percent. Those who identified as Hispanic or Latino but did not identify Mexico, Central America, or South America as their region of origin were about 9 percent.[3] This group included those identifying Spanish or Spanish American ancestry.
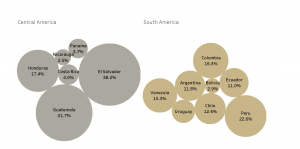
Share of Utah Hispanic or Latino population from country of origin for Central and South America

In the breakouts of those regions, Peru, Colombia and Venezuela are the top countries of origin for South America. El Salvador, Guatemala and Honduras are the top countries of origin for Central America. This aligns with national trends, which show an increase in migration from El Salvador, Guatemala, and Honduras since the Great Recession.
Despite having a diversity of familial origin countries, two-thirds of Utah’s Hispanic or Latino population were born in the USA. Just over half (54 percent) of the native born population are under age 18.[4] The large native born population is also reflected in the use of Spanish. Just over 250,000 Utahns speak Spanish at home. About 1 in 5 of Utah’s Spanish speakers (20 percent) do not speak English very well.[5]
This blog uses data from the 2017 1-Year American Community Survey (ACS) estimates. The ACS provides annual estimates for areas with populations of 65,000 or more, so smaller communities aren’t included in this analysis. For more information, visit https://www.census.gov/programs-surveys/acs/.
Mallory Bateman is a research associate at the Kem C. Gardner Policy Institute.
[1] Table B03003
[2] Table B03003
[3] Table B03001
[4] Table B050031
[5] Table B16006


