
Blog Post
Insight: What does the Gini coefficient show us?

By: Mallory Bateman
Note: The opinions expressed are those of the author alone and do not reflect an institutional position of the Gardner Institute. We hope the opinions shared contribute to the marketplace of ideas and help people as they formulate their own INFORMED DECISIONS™.
Nov 10, 2020 – In the past several weeks, I have gotten a few data requests asking for Gini coefficients at various levels of geography. The Gini coefficient, which is a value from 0 to 1, represents the income inequality across a population, with lower values indicating less inequality and higher values indicating greater inequality. This focus on income distribution provides one economic view of a community, but the measure has significant limitations.
As I examined Gini coefficients for states, metropolitan areas, and cities, I discovered that Utah and some of the places within it have some of the lowest values (most equal income distributions) in the nation. Of cities with populations over 100,000 nationwide, the #1 and #6 ranking fell to West Jordan and West Valley City. From previous research for Salt Lake County and Salt Lake City, I learned that West Jordan and West Valley have very different socioeconomic and demographic characteristics. Gini coefficients measure similarity or difference within an area, not between areas. Bottom line: communities with very similar Gini coefficients can be very different from each other.
The differences that struck me were those impact the economic status of a household or individual. Educational attainment and median household incomes are higher in West Jordan than West Valley, while the share of households in poverty is higher in West Valley. Another question that came to mind was the current environment of COVID-19. West Valley City accounts for nearly 12% of the total county population but is home to over 17% of cases. West Jordan is home to 10% of the population and has just under 10% of the countywide cases. Despite having similar Gini coefficients, the lived economic conditions and experiences within these communities are pretty different.
These differences made me curious about other communities with low Gini coefficients.[i]
States
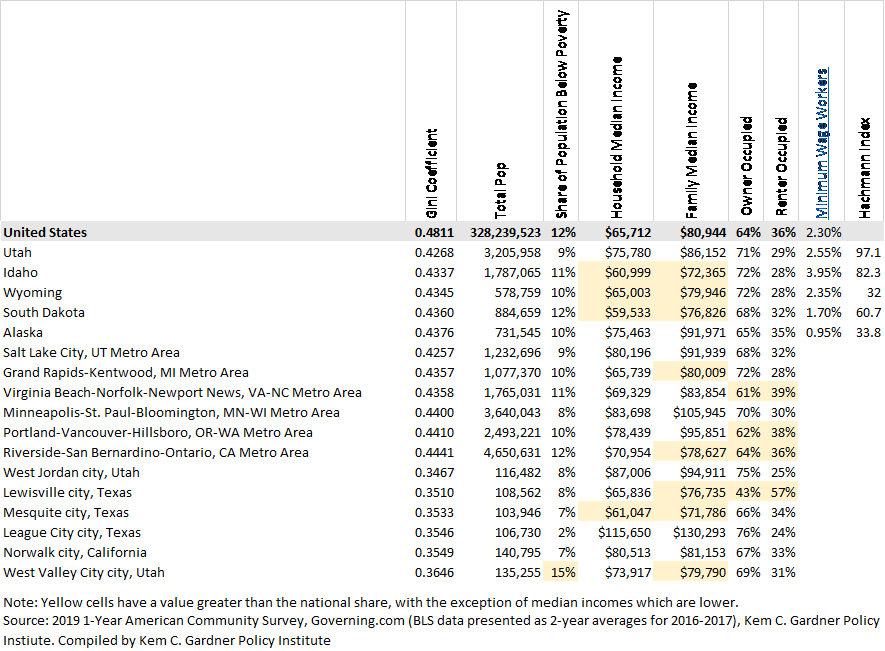
The five states with the lowest Gini coefficients were: Utah, Idaho, Wyoming, South Dakota, and Alaska. Utah has the largest population of the five states with the lowest Gini at 3.2 million people.
- Idaho, South Dakota, and Wyoming have median household and family incomes below the national median.
- All five states have a higher share of homeowners than the nation.
- Idaho, Utah, and Wyoming have a higher share of minimum wage workers than the nation.
- The Hachmann Index, a measure that compares a state’s economy to the nation, varies for the five states. Wyoming and Alaska have very specialized economics and are very different from the national economy. South Dakota falls in the middle, with Idaho and Utah’s economies similar to the nation.
Despite lacking the markers of areas with high COVID cases at the beginning of the pandemic, including large cities and significant racial and ethnic diversity, four of the five states (South Dakota, Utah, Idaho, and Wyoming) are currently in the top 10 states or territories for COVID cases per 100,000 people.
Metropolitan areas
Metropolitan areas are composed of adjacent, economically integrated counties. The five metro areas with the lowest Gini coefficients ranged from two to 16 counties. The lowest Gini coefficient metro areas were: Salt Lake City, Grand Rapids-Kentwood (MI), Virginia Beach-Norfolk-Newport News (VA), Minneapolis-St. Paul-Bloomington (MN/WI), Portland-Vancouver-Hillsboro (OR/WA), Riverside-San Bernardino-Ontario (CA). The five metro areas range from just over 1 million to over 4.6 million.[ii]
- Grand Rapids and Riverside had lower median family incomes than the nation.
- Virginia Beach, Portland, and Riverside had lower shares of homeowners than the nation.
The two counties in the Riverside-San Bernardino metro area currently have case and death rates per 100,000 higher than California. Of the 16 counties in the Virginia Beach-Newport News metro area, six have higher case and death rates than Virginia.
Cities
The six cities with populations over 100,000 and the lowest Gini coefficients were: West Jordan (UT), Lewisville (TX), Mesquite (TX), League City (TX), Norwalk (CA), and West Valley City (UT). The six cities are all similarly sized, with populations under 150,000.
- West Valley City is the only city of the top 6 to have a higher share of the population in poverty than the nation.
- While only one city (Mesquite) had a lower median household income than the nation, three cities had lower median family incomes than the nation.
- Lewisville is the only city on the list with a majority share of renters.
Four of the six cities had COVID-19 case rates higher than their states and one (Norwalk, CA) had a higher death rate than its state.
All of this data illustrates that while an index like the Gini coefficient can be a useful starting point, it only describes similarity or difference within a community. It does not reveal levels. It does not indicate anything about the level of economic success or health of a community. The diversity of the characteristics in this handful of areas shows that there is always more to the story.
Figure: Summary of Selected Variables for States, Metropolitan Areas, and Cities with low Gini Coefficients
Mallory Bateman is a senior research associate and Utah State Data Center coordinator at the Kem C. Gardner Policy Institute.
[i] 2019 1-Year American Community Survey was the primary source for data. COVID-19 rates were compiled using the interactive available from the New York Times and county-level interactives for the cities.
[ii] For reference: there are 54 metro areas with over 1 million people, 42 of which fall between 1 and 4.6 million.


