
Blog Post
Insight: Wasatch Front Air Quality – Getting Better or Worse?
By: Thomas Holst
Skiing on weekends is a relaxing way to appreciate Utah’s snow and the challenging terrain of local resorts. Frequently, an added benefit is to escape an inversion layer in the valley.
Inversions are facilitated by the unique topography along the Wasatch Front. A recent survey conducted for the Utah Clean Air Partnership (UCAIR) shows that Utahns are both informed about the causes of poor air quality and will assume responsibility for implementing solutions:[i]
- Vehicles were correctly identified as the largest contributor to poor air quality.
- Fifty-seven percent of respondents stated that individuals are responsible for improving air quality, followed by state government (36 percent), and the federal government (16 percent).
- Over half of the respondents stated they take measures to improve air quality, but only if it’s convenient or saves them money; one-quarter take measures even it means sacrificing convenience.
Regarding personal driving habits during inversion periods, over half of the respondents surveyed said they carpool instead of driving. Three-quarters said they would telecommute if their employer offered that option.
Taking public transport was identified as the top method of changing Utah driving habits. Last year, TRAX waived fares during inversion periods, incentivizing respondents who stated they’d take measures to improve air quality only if it saves them money.
The UCAIR survey is a positive indicator of personal responsibility being taken for Utah air quality. Between 2002 and 2017, Utah’s population increased 34 percent while Utah’s emission of health-threatening air pollutants such as CO, NOX, PM10, PM 2.5, and SO2 have dropped 38 percent.[ii] The drop in these pollutants is a positive step for at-risk population sectors suffering from cardiovascular and respiratory diseases.
While greenhouse gases such as carbon dioxide don’t pose an immediate health risk, the longer-term impact of greenhouse gases has been documented by the 4th National Climate Assessment.[iii] How do Utah’s carbon dioxide emissions levels stack up versus national or international levels? Is there room for improvement?
Utah emits only 1 percent of total U.S. carbon dioxide emissions, but the state’s per capita emissions rate (19 tons per person) is relatively large compared with neighboring states (see figure). Internationally, Utah’s per capita carbon dioxide emissions rate is higher than that of China (11), India (2), and the average of all EU28 countries (7).
We will face difficult choices over the next decade about safeguarding clean air that is consistent with Utah’s image as an outdoors, recreation-oriented state.
Thomas Holst is a senior energy analyst at the Gardner Policy Institute.
Figure 1: Western States’ Carbon Dioxide Emissions, Total and Per Capita, 2016
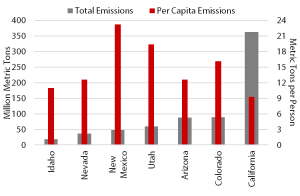
Source: Energy Information Administration and U.S. Census Bureau
[i] Lighthouse Research & Development Inc., “Air Quality General Public Survey Results prepared for UCAIR,” September 2018. Results based on 408 interviews, +/– 5.0 percent error.
[ii] Utah Clean Air Partnership Summit, 6 February 2019, utahpolicy.com/index.php/features/featured-articles/19354-governor-herbert-ucair-executive-director-report-air-quality-milestones-at-annual-show-ucair-summit
[iii] Fourth National Climate Assessment, U.S. Global Change Research Program, available at nca2018.globalchange.gov.


