
Blog Post
Insight: Utah’s Travel and Tourism Industry: Holding Strong with Shifting Trends
By: Jennifer Leaver
Note: The opinions expressed are those of the author alone and do not reflect an institutional position of the Gardner Institute. We hope the opinions shared contribute to the marketplace of ideas and help people as they formulate their own INFORMED DECISIONS™.
Nov 14, 2019 – Out this week, the Gardner Institute’s Travel and Tourism Industry report shows Utah’s eighth largest industry continues to hold strong, despite shifting trends. In 2018, Utah visitors directly spent a record $9.75 billion in the Utah economy—a 6.5% increase from the previous year. This spending supported 136,000 Utah jobs and generated $1.28 billion in total tax revenue.
Travel and Tourism–Generated Tax Revenue, 2018
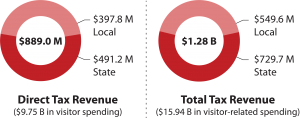
Source: Kem C. Gardner Policy Institute analysis of
U.S. Travel Association and Utah State Tax Commission Data
Utah’s ski resorts, state parks, and national parks all experienced record visitation in 2018. The state’s 2018–2019 ski season, which delivered abundant powder right through spring, drew an unprecedented number of skiers and snowboarders to Utah’s slopes, generating a record $1.3 billion in skier/snowboarder spending. Likewise, Utah’s state parks reported 6.7 million visits in fiscal year 2018, up 17.9% from fiscal year 2017; and Utah’s national park visitation reached its highest level ever at 10.6 million visits.
However, not everything travel and tourism–related set a record in 2018. Utah’s national places experienced a 6.2% year-over-year decline in visitation.[1] Overall international visitor spending was down slightly and year-over-year spending by Chinese visitors (Utah’s second largest international market) declined 5.6%, or by $7.8 million. Utah’s average annual hotel occupancy rate decreased from 65.3% in 2017 to 64.1% in 2018, while average daily hotel room rates remained flat.
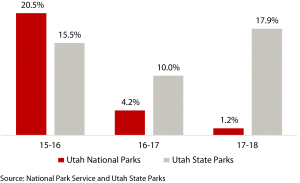
So, what’s behind this increase in Utah visitation and spending, but deceleration and decline in certain aspects of Utah’s travel and tourism economy? For one, there has been a marketing shift away from Utah’s popular Mighty 5® national parks and towards Utah’s less-visited, but equally stunning, state parks. In 2016, the Utah Office of Tourism launched its “Road to Mighty” ad campaign to encourage visitors to explore places along the way and in-between Utah’s national parks. Data over the past four years show that state park visitation has been increasing faster than national park visitation.
Annual Change in Park Visitation
Second, a decline in Chinese visitation and spending was generally attributable to geopolitics and, more specifically, to tenuous U.S.–China relations. Recently, Beijing has issued several U.S. travel warnings to its citizens, including messaging about American gun violence and U.S. law enforcement harassment. In addition, U.S. travel visa rejection rates for Chinese travelers have doubled from 2013 (8.5%) to 2018 (17%).[2]
Finally, supply vs. demand contributed to Utah’s less-than-stellar hotel performance in 2018. There were more hotels in 2018 vs. 2017 and an increasing supply of short-term rentals (vs. hotels). Thus, even though visitation and overnight accommodations demand increased in 2018, Utah’s supply grew faster.
However, regardless of national park visitation deceleration, international visitor spending declines, and temperate hotel performance measures, Utah’s visitor economy continues to grow. Compared with the first half of 2018, county transient room tax revenue collected during the first half of 2019 was up 3.9%, taxable leisure and hospitality sales increased by 6.1%, and state park visitation grew 14%.
Jennifer Leaver is the senior tourism analyst at the Kem C. Gardner Policy Institute.
[1] Bears Ears NM and Flaming Gorge NRA not included.


