
Blog Post
Insight: Utah’s Single Population

By: Heidi Prior
Note: The opinions expressed are those of the author alone and do not reflect an institutional position of the Gardner Institute. We hope the opinions shared contribute to the marketplace of ideas and help people as they formulate their own INFORMED DECISIONS™.
Nov 9, 2022 – Planning to attend your family Thanksgiving celebration without a date? You aren’t alone! When grandma asks why you aren’t married yet, try sharing these Census Bureau findings.
This blog includes data from the 2021 1-year American Community Survey and defines “single” or “unmarried” as a resident who never married or is divorced or widowed. Questions on marital status have been asked of the population 15 and over[i] since the 2008 ACS[ii]. The survey’s married population includes both same-sex and opposite-sex couples, a practice adopted by the ACS in 2013.
Utah features the smallest share of single adults in the nation.
In 2021, 43.6% of Utahns age fifteen and older were single. This was the lowest proportion of unmarried residents in any U.S. state, followed by neighboring states Idaho (44.1%) and Wyoming (44.8%). In contrast, Louisiana (54.4%), Rhode Island (53.7%), and New Mexico (53.6%) reported the highest proportion of single residents in the United States.
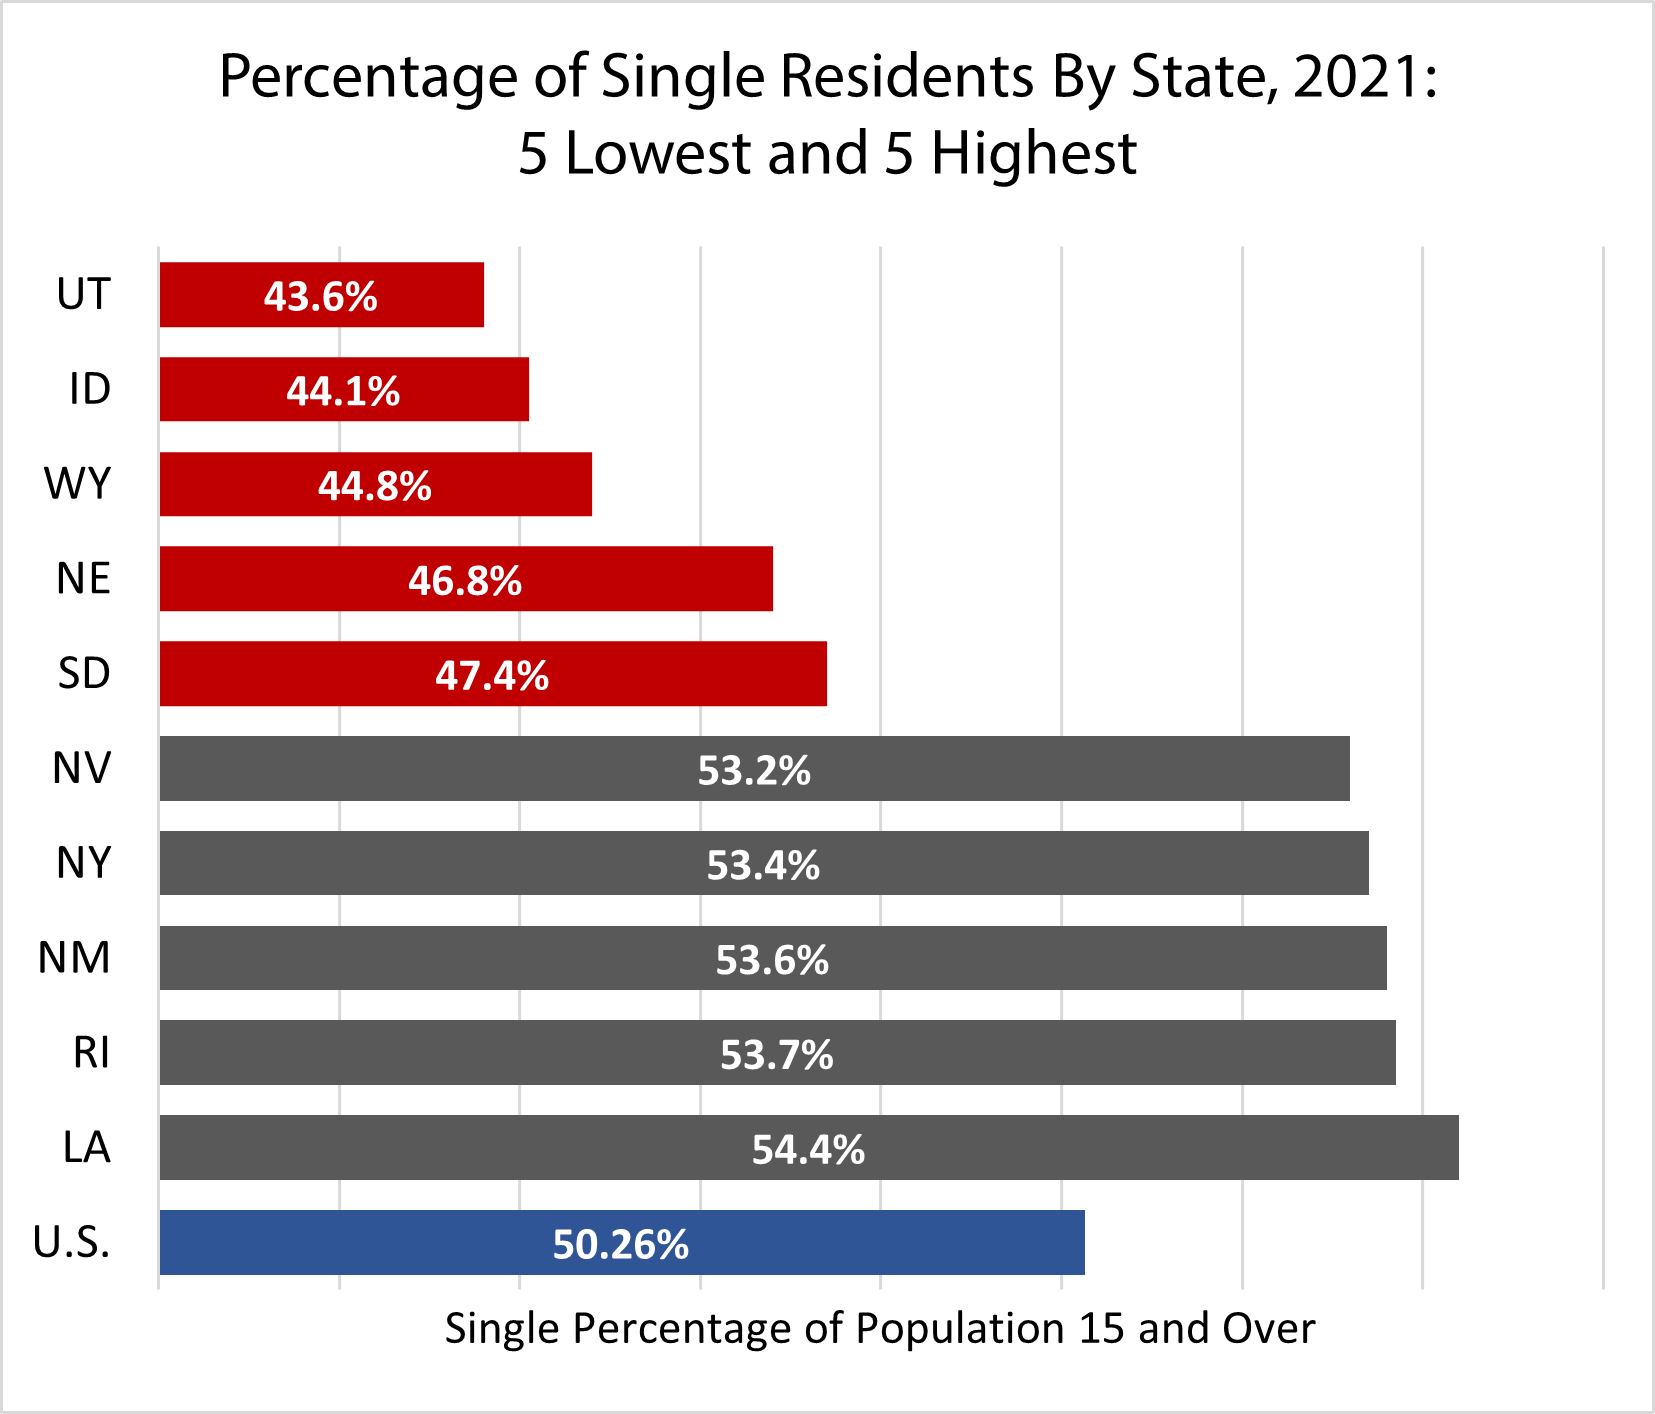
Source: U.S. Census Bureau, American Community Survey 1-Year Estimates, 2021
Utah has long featured large households and a low percentage of single adults compared to other states. In 1980, 1990, 2000, and 2010 Utah ranked in the bottom three states for its proportion of single residents.
In Utah single men outnumber single women, especially in younger age groups.
In Utah, men are slightly more likely than women to be single or unmarried. In 2021, 44% of Utah men age fifteen and older were unmarried compared to 43% of Utah women. Nationally, however, single women outnumbered men. 52% of U.S. women reported they were single, compared to 49% of U.S. men.
Within the 20 to 34 age group, the data tells a different story. Young men in Utah and across the nation consistently report higher rates of singleness than their female peers. In 2021, 61% of Utah men aged 20 to 34 were single compared to 49% of women in the same age group. In fact, Utah had 119 unmarried men ages 15 to 44 for every 100 unmarried women ages 15 to 44.
Utah’s abundance of single men fades in older age groups. The gap between unmarried men and women narrows between ages 35 and 64, with rates of singleness differing by only 1 to 3 percentage points. As Utahns approach retirement age, this gap widens again, but this time with single women outnumbering single men. In 2021, 22% of Utah men aged 65 and older indicated they were unmarried compared to 43% of their female peers. Much of this difference can be attributed to women’s higher life expectancy and higher rates of widowhood.
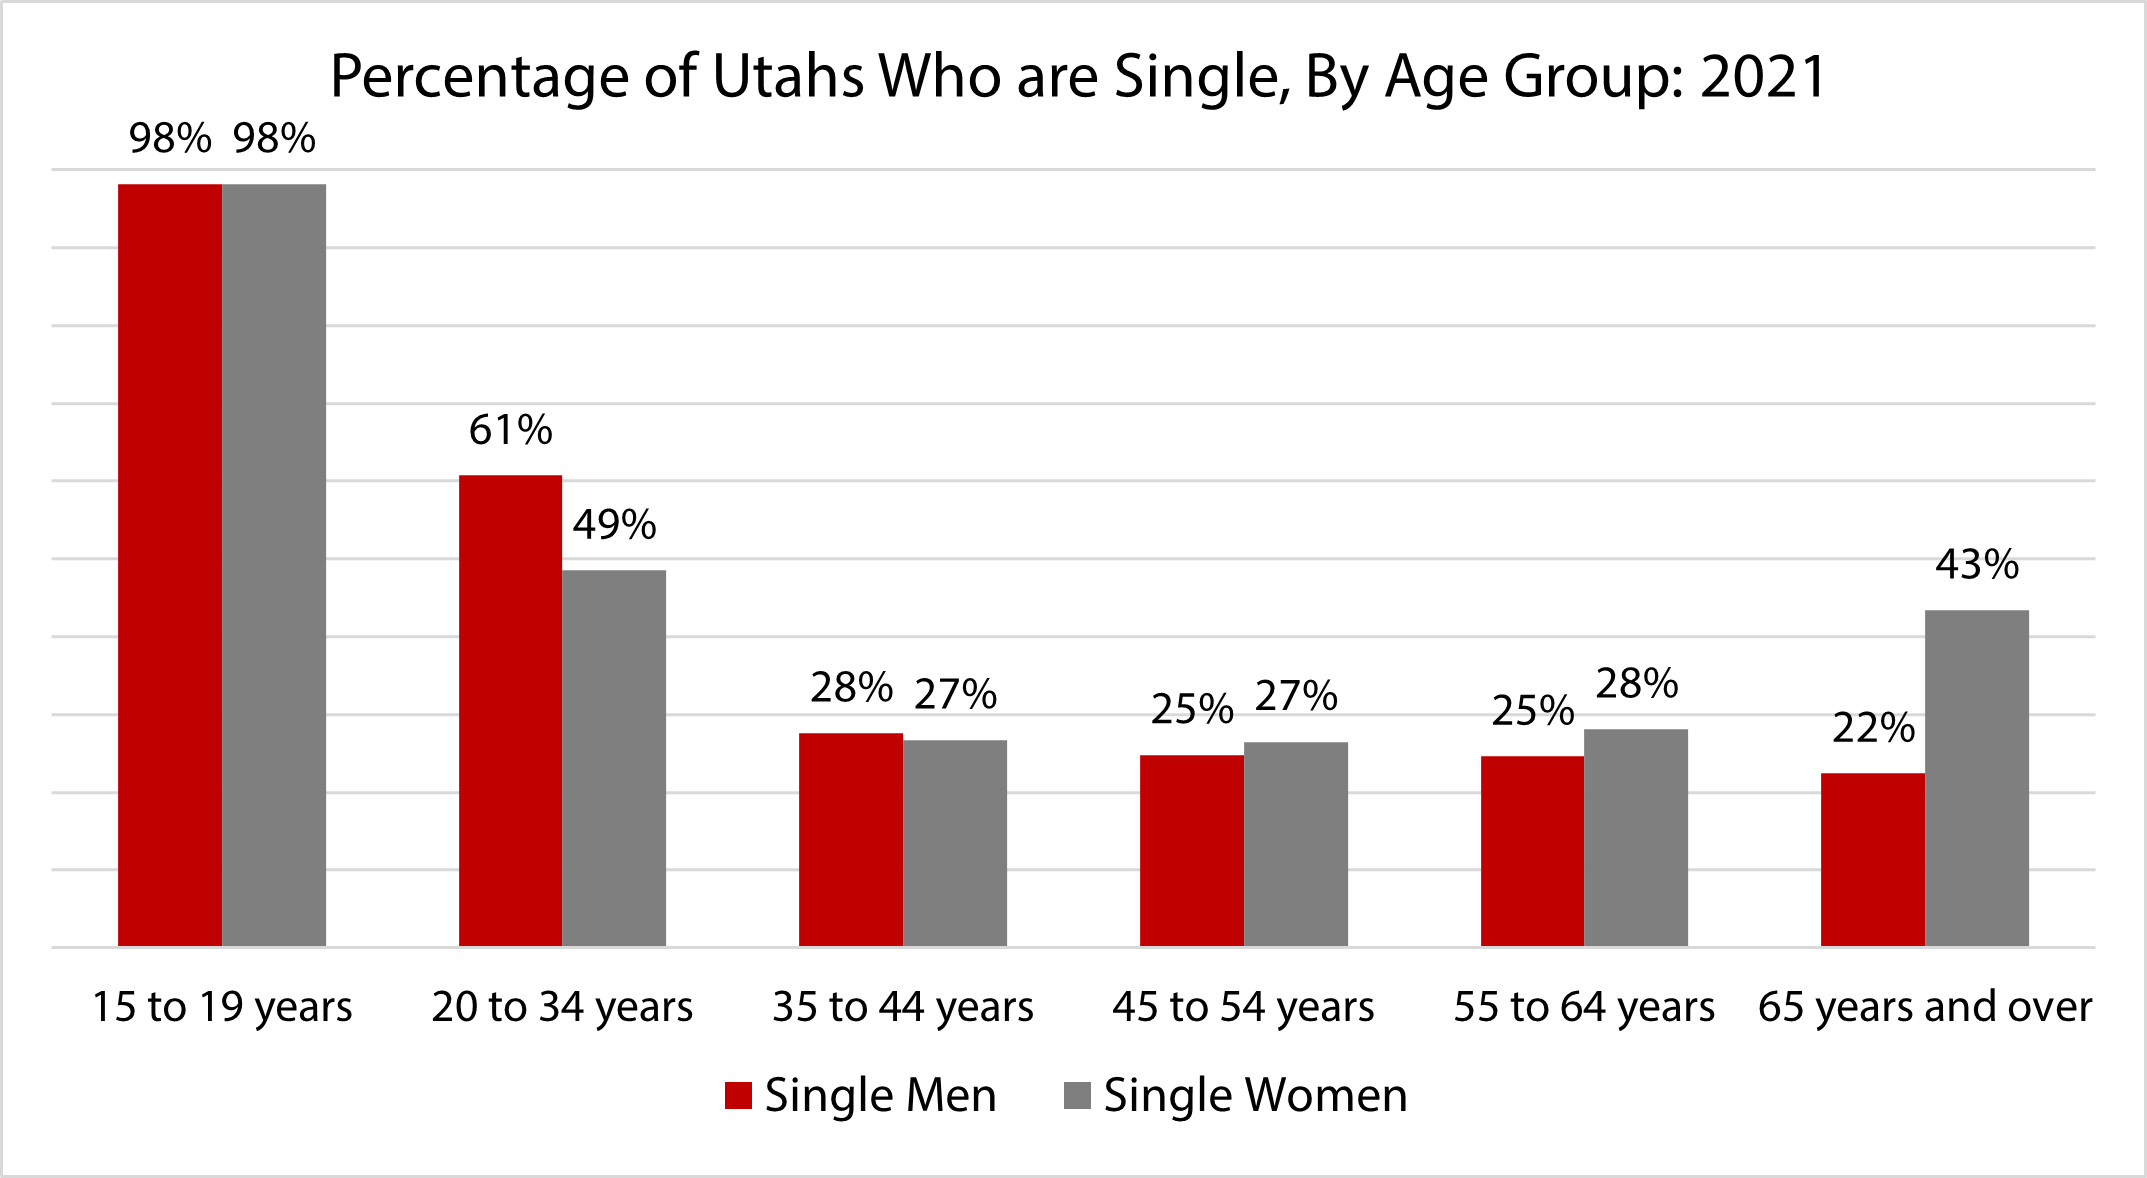
Source: U.S. Census Bureau, American Community Survey 1-Year Estimates, 2021
Utah’s racial minorities reported higher unmarried rates.
In 2021, members of Utah’s minority groups were more likely to be single than their White peers. Black or African American Utahns age 15 and up had the highest unmarried rate: 62%, followed by American Indian or Alaskan Native Utahns at 60%. White Utahns had the lowest unmarried rate: 42%.[iii] Hispanic or Latino Utahns also reported higher unmarried rates, 51%, compared to 41% of non-Hispanic White Utahns.[iv]
Utah singles are highly mobile.
Single adults composed the majority of new residents who migrated to Utah in 2021. 57% of individuals who relocated from other states and 56% of those who moved from abroad were single. This aligns with prior research using pre-pandemic data. Single adults also proved more mobile within Utah, making up 54% of residents who changed addresses within the state, even though they composed only 44% of the adult population.
Utah’s singleness rates are rising.
Nationally, the U.S. single population has steadily grown in relation to the married population. Here in Utah, a similar trend emerges. Utah grew from 36% single in 1980, to 40% single in 2000, to 44% single today.
If a demographic summary of your state’s single population isn’t enough to satisfy inquiring relatives, just ask for more stuffing and rest assured that plenty of other Utahns are fielding the same questions.
Heidi Prior is a research associate at the Kem C. Gardner Policy Institute.
[i] Many people assume that all fifteen-year-olds are single, but a small number of teenagers do get married. In Utah, nearly 2% of 15 to 19-year-olds were married in 2021. According to Pew Research Center, 4 of every 1,000 15 to 17-year-old Utahns were married in 2014. That’s below the national average.
[ii] The ACS includes populations living in group quarters (correctional facilities, nursing homes, mental hospitals, college dormitories, military housing, group homes, and homeless shelters) in its data. Some types of group quarters populations have unique marital status distributions. Utah’s group quarters population represents a small share of the population and should minimally impact the data presented in this blog.
[iii] These differences may be related to the younger age profiles of many of Utah’s minority racial groups. In 2021, the median age for Utahns who identified as White alone was 33.3 years old compared to 25.8 years old for those who identified as Black alone. Utahns who identified as American Indian or Alaskan Native (alone or in combination with other races) also tended to be younger than White Utahns, with a median age of 27.9
[iv] Utah’s Latino population is also much younger than its White population. The median age of the Latino population in Utah is 26.2 compared to 33.9 for the non-Hispanic White population.


