
Blog Post
Insight: Utah’s Air Quality: Zeroing in on Health Impacts
By: Laura Summers
Note: The opinions expressed are those of the author alone and do not reflect an institutional position of the Gardner Institute. We hope the opinions shared contribute to the marketplace of ideas and help people as they formulate their own INFORMED DECISIONS™.
The Kem C. Gardner Policy Institute is currently developing a roadmap of possible solutions for the Utah Legislature to consider in addressing Utah’s air quality and changing climate. This process includes evaluating existing research on how poor air quality impacts our environment, economy, and our health.
As the senior health care analyst, I had an opportunity to assist in gathering the health impact research—and the body of Utah-specific studies is both impressive and alarming.
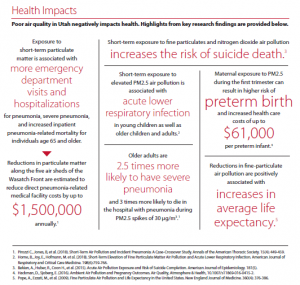
As noted in the research presented above, short-term exposure to fine particulate matter is linked to increased risk for pneumonia, acute lower respiratory infection, preterm birth, and suicide (among many other health risk factors noted in the broader literature). PM2.5 is particulate matter pollution that is 2.5 micrometers and smaller.[i] It exists in Utah’s inversions and wildfire smoke and cannot be filtered through common dust or surgical masks.
Figure 1 shows the effects from Utah’s 2018 fire season on PM2.5 concentrations from July to September 2018 (this includes the Dollar Ridge, Bald Mountain, Pole Creek, and other wildfires). The 24-hour air quality standard for PM2.5 is 35 µg/m3, which is marked with a black line.
Figure 1
Daily PM2.5 Concentrations at Utah Monitoring Stations, July–September 2018
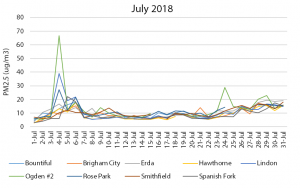
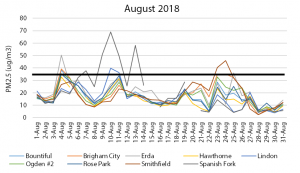
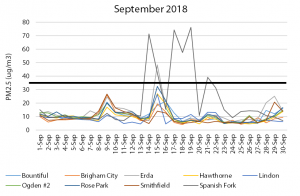
Source: Utah Division of Air Quality
As the weather cools and we begin preparing for the fall, I’m grateful that Utah’s 2019 wildfire season was less intense than 2018; however, this is also the time of year when inversions begin to settle over the valley, yet again increasing our exposure to short-term particulate matter. Vulnerable populations, including children, the elderly, persons in poverty, persons with preexisting health conditions, and persons engaged in labor activities (such as construction and agricultural workers) or living in geographic areas most affected by air pollution, are particularly at risk.[ii]
The Centers for Disease Control and Prevention developed the Social Vulnerability Index to identify areas vulnerable to external stresses on human health (like poor air quality), natural disasters, and disease outbreaks.[iii] The index uses 15 variables to rank each area in a state against other areas in order to measure relative vulnerability.
Figure 2 shows the social vulnerability scores for Utah by census tract. Data show that areas in southwest Provo, west Salt Lake, central Ogden, and San Juan County have the highest scores (above 0.99, with one being the highest).
Figure 2
Social Vulnerability in Utah by Census Tract, 2016
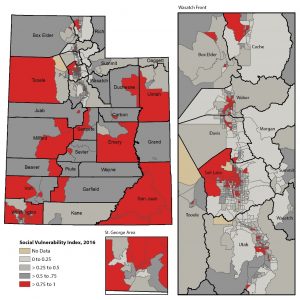
Note: Areas with a score closer to 1 indicate high vulnerability. The areas are ranked
against other areas in the state to measure relative vulnerability within the state.
Source: Social Vulnerability Index, Centers for Disease Control and Prevention.
Addressing Utah’s poor air quality isn’t easy, but doing so will have positive impacts on the health of all Utahns, and particularly Utah’s vulnerable populations. These groups are at the greatest risk for negative health impacts from poor air quality and other climate events.
Laura Summers is the senior health care analyst at the Kem C. Gardner Policy Institute.
[i] Particulate Matter (PM) Basics. Particulate Matter (PM) Pollution. United Sates Environmental Protection Agency (EPA). Retrieved from https://www.epa.gov/pm-pollution/particulate-matter-pm-basics#PM.
[ii] Lancet Commission.
[iii] CDC’s Social Vulnerability Index. Agency for Toxic Substances and Disease Registry. Centers for Disease Control and Prevention. Retrieved from https://svi.cdc.gov/.


