
Blog Post
Insight: Utah Leads the Nation in Population Growth, 2010 – 2019

By: Pamela Perlich
Note: The opinions expressed are those of the author alone and do not reflect an institutional position of the Gardner Institute. We hope the opinions shared contribute to the marketplace of ideas and help people as they formulate their own INFORMED DECISIONS™.
Dec 31, 2019 – I moved to Utah in 1986 when the state population was 1.7 million, just over half the 3.2 million population of today. Having experienced and studied this growth for over three decades, I can tell you that present-day Utah is not simply a twice-as-large version of its former self. This growth dynamic has intensified since 1990 as Utah has become more globally interconnected, through markets, technology, and migrations of people. Here in the Greater Wasatch Front, we have become a much more urbanized metropolitan region.
Although the Great Recession interrupted the trend, the growth dynamic in the Intermountain Region – including Idaho, Nevada, Arizona, and Utah – has persisted for the last three decades. Since 2010, these four states have been among the most rapidly growing in the nation.
Data released this week by the U.S. Census Bureau confirms that recent population growth in Utah is among the most rapid in the nation. Once again, the states in the Intermountain West lead the nation in rates of growth. Top states for population growth rates from 2018 to 2019 were:
Population Growth Rates, 2018-2019
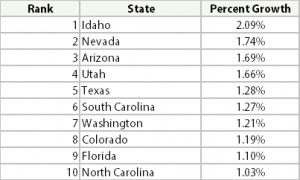
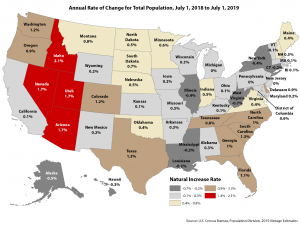
Source: US Census Bureau, Population Division, 2019 Vintage Estimates
The US population growth rate was 0.5% for the same period. The Northeast and Midwest lost population as people continue to migrate from those regions. The South and West gained population, both through natural increase and net in-migration. Growth rates continue to decelerate nationally as the population ages, fertility declines, and net international migration slows.
The Census Bureau estimates that Utah added about 52,000 people last year, with about 60% coming from natural increase (births minus deaths) and 40% from net in-migration (in-migration minus out-migration.)
Utah maintains the highest per capita rate of births (15.3 per 1,000 population), lowest per capita deaths (5.5 per 1,000 population), and highest per capita rate of natural increase (9.8 per 1,000 population). While a greater share of Utah’s population growth is contributed by net in-migration, it ranks 12th among states in per capita net in-migration (6.7 per 1,000 population). In contrast, the other most rapidly growing states have the highest per capita rates of net migration: Idaho (15.6 per 1,000), Nevada (13.8 per 1,000), and Arizona (13.7 per 1,000).
Considering the entire 2010 to 2019 period, Utah has the most rapid growth rate of all states. The state population is estimated by the Bureau of the Census to have grown from 2.76 million in 2010 to 3.21 million in 2019. That’s an increase of 442,000 or 16%. Over this same period, Utah advanced in state population size rankings from 34 to 30.
Earlier this month, we released our population estimates, produced by the Utah Population Committee. Our methods and data are customized to Utah and differ from the uniform approach that the Census Bureau has used for all states. We are ten years past our most recent decennial enumeration of 2010. Even with these different methods and long postcensal estimation horizon, our state estimates are within 14,000 of those produced by the Census Bureau. We do differ somewhat in components of population change. But the broad outlines of the demographic story of Utah are the same – we remain a place of growth and change.
The 2020 Census will bring a fresh set of much more accurate data to help us understand Utah’s evolving demographic landscape.
Pamela Perlich is the director of demographic research at the Kem C. Gardner Policy Institute.


