
Blog Post
Insight: Race/Ethnicity in the Wasatch Front Labor Force: An Equal Employment Opportunity Analysis

By: Emily Harris
State and local governments are required to submit an annual demographic analysis of their workforce to ensure that they are compliant with the Equal Employment Opportunity (EEO) Act. Federal law prohibits discrimination on the basis of age, sex, race, sexual orientation, disability, and more, and applies to personnel functions including hiring, compensation, promotions, and termination.[1] Most public and private organizations with over 15 employees are required to follow these federally mandated EEO practices. Employers that embrace and ensure these EEO policies are more likely to have quicker talent recruitment, higher retention, and better overall employee satisfaction.
We produce annual updates of an EEO analysis of the Wasatch Front Labor Force (Salt Lake, Davis, Summit, Tooele, Utah, and Weber counties) for Salt Lake City Corporation.
Our regional labor market analysis provides help for employers, not just Salt Lake City government, in understanding how their current employees compare to the regional labor force. A major contribution of this report is that it is a regional analysis using the state government level occupational categories. That means that any state or local government entity in the Wasatch Front region can utilize this report for their EEO needs.These people are potential future employees, and the region’s changing demographics have an impact as we move into the future.
This research brief tracks the changing racial/ethnic and gendered makeup of the Wasatch Front labor force across eight different occupations and answers the questions:
What does the labor force currently look like?
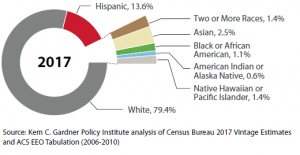
Total Civilian Labor Force by Race/Ethnicity (2017)
Davis, Salt Lake, Summit, Tooele, Utah, and Weber Counties
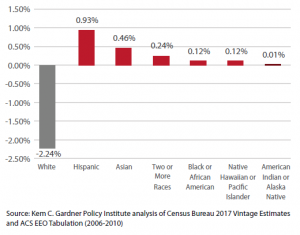
How has the labor force changed since 2010?
Percentage Change in Racial/Ethnic Workforce Composition, 2010-2017
Davis, Salt Lake, Summit, Tooele, Utah, and Weber Counties
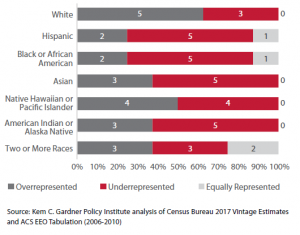
How is race/ethnicity represented across occupations?
If we compare the total labor force racial composition to the racial composition within different occupations:
- Minorities are most underrepresented in the Professionals category,
- Whites are most underrepresented in the Service and Maintenance category,
- Women are especially underrepresented in the Skilled Craft category, and
- Males are significantly underrepresented in the Paraprofessionals category.
Summary of Racial Representation Across Occupations (2017)
Davis, Salt Lake, Summit, Tooele, Utah, and Weber Counties
Occupational Classifications
- Officials and Administrators
- Professionals
- Technicians
- Protective Services
- Paraprofessionals
- Administrative Support
- Skilled Craft
- Service Maintenance
Utah and the Wasatch Front region’s increasing diversity translates to an increasingly diverse labor force. Regional employers benefit by understanding these changing demographics and developing hiring and employment practices that support and provide opportunities for the changing local population. For more detail and information, read the full report here.
Emily Harris is demographer at the Kem C. Gardner Policy Institute.
[1] For more information about legal protections visit the U.S. Equal Employment Opportunity Commision at www.eeoc.gov


