
Blog Post
Insight: Most of the Nation Experiences Increasing Fertility Rates in 2021, but Not Utah

Author: Emily Harris, Senior Demographer
Note: The opinions expressed are those of the author alone and do not reflect an institutional position of the Gardner Institute. We hope the opinions shared contribute to the marketplace of ideas and help people as they formulate their own INFORMED DECISIONS™.
Mar 3, 2023 – How does that headline make you feel? Some will read it and think it’s positive, and some will read it and feel alarmed. Regardless of how you feel about increasing or decreasing fertility rates, I encourage you to continue reading so that you can begin to understand the nuances of fertility in America.
Fertility in the U.S. has been in a steady decline almost every year since the Great Recession in 2008. In spring of 2022, preliminary data revealed that the U.S. total fertility rate (TFR) increased for the first time since 2014. But we were left to wonder what state-level TFRs looked like and what might be in store for Utah. The wait is finally over and there are some interesting data points from this latest release.[i]
Utah’s 2021 TFR, 1.918, remains 4th highest in the nation behind South Dakota, North Dakota, and Nebraska. Utah’s TFR remained about the same, declining from 1.921 to 1.918. This is the first time since 2012 that Utah’s TFR did not decline by a substantial amount (1% or more). Utah’s TFR declined an average of 2.2% every year since 2009 (sometimes by more than 5% and sometimes barely at all), but this year it only declined by .1%.[ii]
The U.S. TFR increased 1% to 1.66 children per woman (up from 1.64). TFR increased over 1% in Washington D.C. and 29 states. Only 2 states saw a TFR decline over 1%, with the remaining states experiencing very little change in their TFR. Population estimates, used as denominators when calculating fertility rates, are the main source of error in population rates and leave a small amount of uncertainty in the exact accuracy of rates. So, I encourage you to interpret TFR percent changes between -1% and 1% with caution, almost as if they fall within some margin of error.
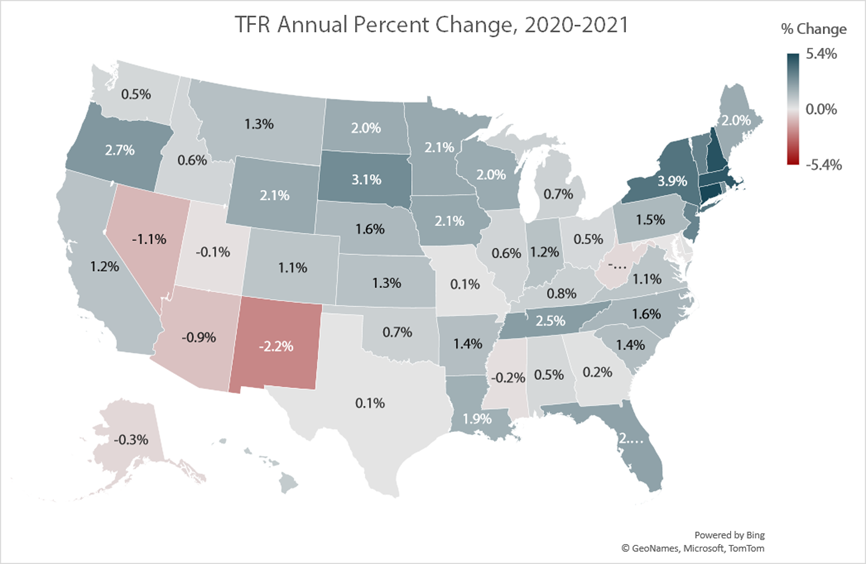
SOURCE: National Center for Health Statistics, National Vital Statistics System, Natality.
Utah’s age specific fertility rates (ASFRs) typically decline across every age category, but this year is an exception. Total Fertility Rates are the sum of ASFRs, meaning that changes in the ASFRs contribute to the overall change in the TFR. Utah’s peak childbearing age (ASFR) of 25-29 saw a sizeable increase, preventing Utah’s TFR from declining at its normal rate. This is the first time since 2012 that Utah has seen an increase in its peak child bearing ages. Many other age groups saw typical ASFR declines (except for ages 35-39 and 45-59).
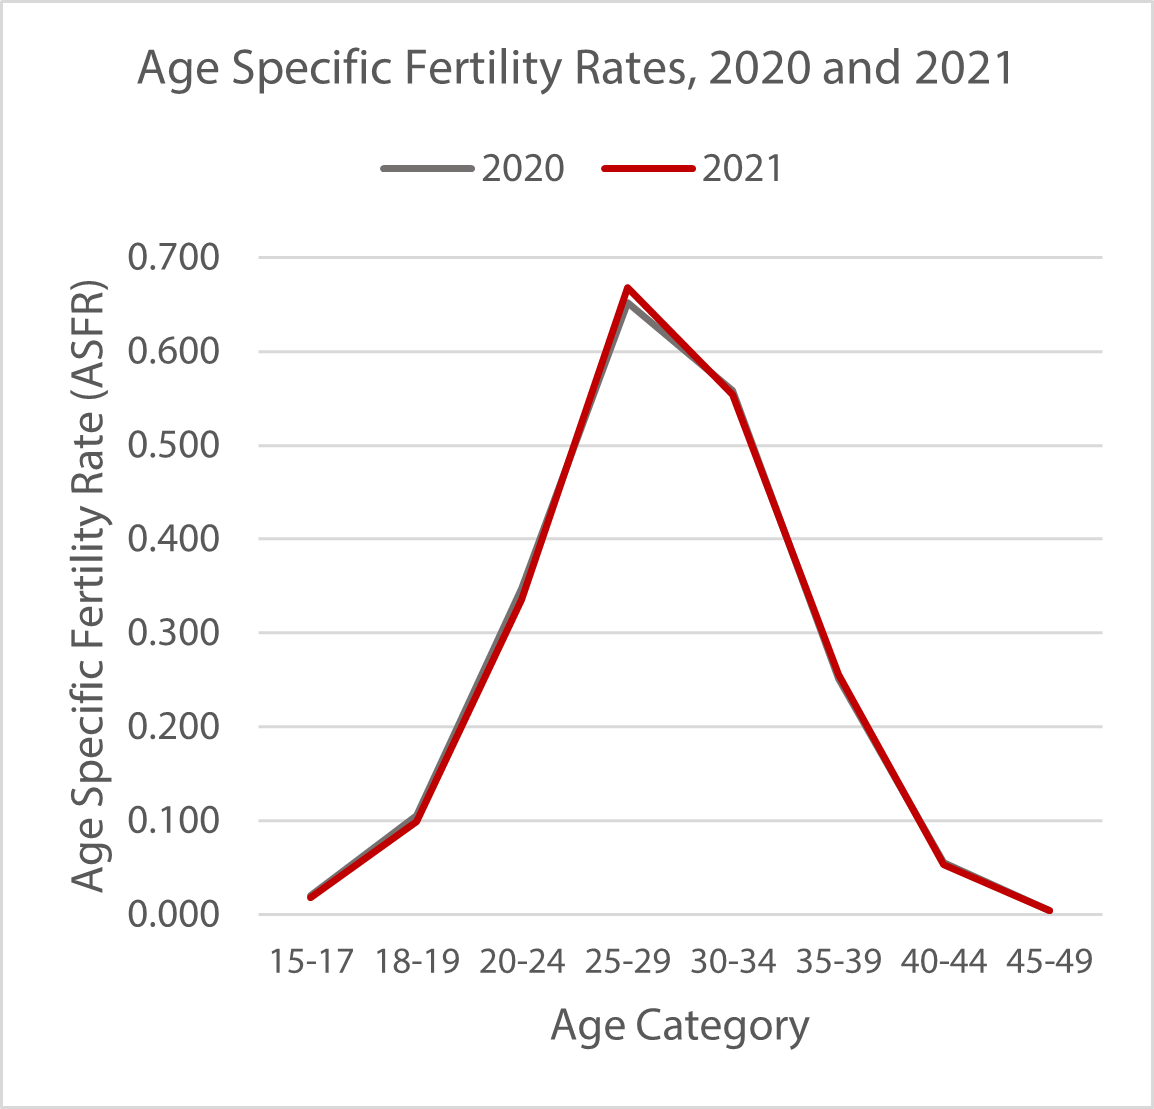
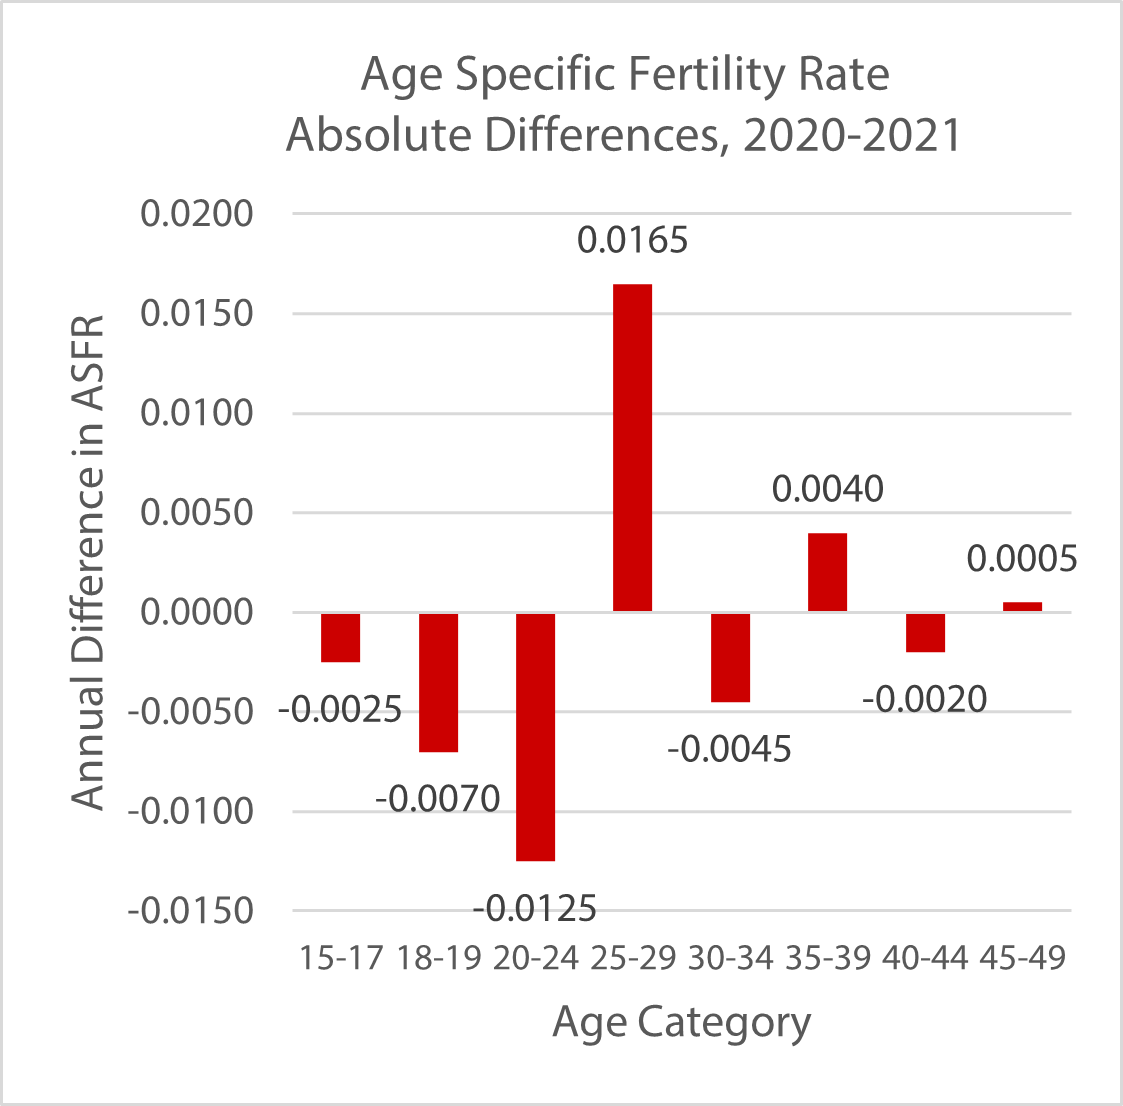
SOURCE: National Center for Health Statistics, National Vital Statistics System, Natality.
This data release indicates a slight reverse in the fertility rate trends that have occurred since the Great Recession, but we don’t yet know how long this will last. Will TFRs continue to increase for a while? Is this just a blip? Will TFRs decline again after this year’s increase? We don’t really know, but if the last few years have taught me anything about life, demographic trends, and the economy, it’s to expect the unexpected. So, stay tuned!
Emily Harris is a senior demographer at the Kem C. Gardner Policy Institute.
[i] Osterman MJK, Hamilton BE, Martin JA, Driscoll AK, Valenzuela CP. Births: Final data for 2021. National Vital Statistics Reports; vol 72, no 1. Hyattsville, MD: National Center for Health Statistics. 2023. DOI: https://dx.doi. org/10.15620/cdc:122047
[ii] This change in Utah’s TFR is so small that we would not consider this statistically significant. Therefore, we would consider this to indicate no change in Utah’s TFR.


