
Blog Post
Insight: Medical Inflation in Utah: The Ups and Downs of Data and Measurement

By: Laura Summers
Curbing the cost of medical care is one of the hottest health care topics right now—and with good reason. Surprise medical bills, the rising cost of prescription drugs, and a lack of price transparency in the health care market have frustrated the public and have policymakers looking for solutions. And while our collective pocketbooks have all experienced the squeeze of health care costs, what does the rise in these costs look like from a national and state perspective?
National Measures of Inflation
The Bureau of Labor Statistics’ (BLS) Consumer Price Index (CPI) is one of the most commonly used measures of inflation. “The CPI measures inflation by tracking retail prices of a good or service of a constant quality and quantity over time. Tracking retail prices allows CPI to capture changes in out-of-pocket household spending.”[1] ‘Medical care’ is one of eight categories used to determine the CPI. BLS defines out-of-pocket medical spending as:
- Patient payments made directly to retail establishments for medical goods and services;
- Health insurance premiums paid for by the consumer, including Medicare Part B; and
- Health insurance premiums deducted from employee paychecks.
While data from BLS show a positive inflation rate for medical care over the last 50 years, the current inflation rate is approaching some of its lowest levels in history (Figure 1).
Figure 1: Medical Care Inflation, 1949‒2019
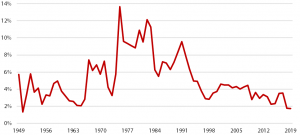
Note: Seasonally Adjusted Annual Inflation.
Source: Bureau of Labor Statistics CPI-All Urban Consumers (Current Series).
These low levels persist when breaking out medical inflation’s sub-components. The medical care index is comprised of two components: services and commodities. Medical care services includes professional services, hospital and related services, and health insurance. Medical care commodities includes medicinal drugs and medical equipment and supplies.
Initial data from 2019 show a positive inflation rate for medical services, 2.4 percent, and a negative inflation rate for medical commodities, -1.1 percent (Figure 2). This is surprising given the amount of political attention focused on prescription drug prices. However, states and health systems have been calling attention to the rising cost of medicine for years, which is reflective of the decade high inflation experienced in 2017.
Figure 2: Inflation for Medical Care Services and Commodities, 1969‒2019
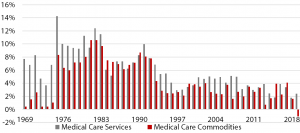
Note: Seasonally Adjusted Annual Inflation.
Source: Bureau of Labor Statistics CPI-All Urban Consumers (Current Series).
State Measures of Inflation
While historical data provides a helpful context for evaluating current increases in health care prices, what really matters to Utahns is the pace at which health care prices are rising here and now. Unfortunately, there is not a good measure of medical care inflation at the state level. Data from Zions Bank’s March 2019 Economic Snapshot shows general inflation for the Wasatch Front significantly outpaces national inflation at 4.8 percent vs. 1.6 percent. [2] However, it does not provide a measure for medical inflation.
BLS does not provide state-level estimates for inflation. The best proxies are CPI estimates for the Mountain Division and West Region B/C, which includes areas with a population size less than 2.5 million (Table 1).
Table 1: Mountain Division and West Region Inflation Rates, February 2018 – February 2019
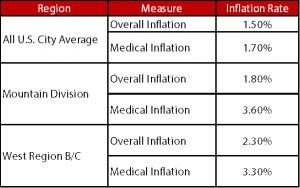
Note: Not Seasonally Adjusted.
Source: Bureau of Labor Statistics CPI-All Urban Consumers (Current Series).
The downside to using the Mountain Division data is that it includes estimates for Arizona, Colorado, Idaho, Montana, Nevada, New Mexico, Utah, and Wyoming. Less populated states like Montana and Wyoming could potentially drive down the average. While West Region B/C data only includes similarly populated areas, it includes areas from the Mountain Division as well as pacific coast states, such as California, Alaska, and Hawaii. These states are less demographically and economically similar to Utah.
Having an accurate Utah-specific measure of medical inflation could be difficult to create, but may be helpful to the public and policymakers as the state examines policies to lower health care costs and improve price transparency. It will also help researchers evaluate whether state and national policies have a positive effect on lowering health care prices in Utah.
Laura Summers is a senior health care analyst at the Kem C. Gardner Policy Institute.
[1] Measuring Price Change in the CPI: Medical Care (2019, March 21). Bureau of Labor Statistics. Available from https://www.bls.gov/cpi/factsheets/medical-care.htm.
[2] Economic Snapshot: Utah. (March 2019). Zions Bank. Available from https://www.zionsbank.com/content/dam/zfnb/zionsbank/documents/economics/economic_snapshot/2019/1903UTSnapshotFinal.pdf


