
Blog Post
Insight: Measuring Economic Diversity: The Hachman Index, 2017

By: DJ Benway
This week the Gardner Policy Institute released the first annual research brief, Measuring Economic Diversity: The Hachman Index, 2017. The Hachman Index is a measure of the economic diversity of a region based on how closely the composition of industries matches that of a larger and well-diversified reference region. The index was developed by Frank Hachman, economist and Associate Director of the forerunner to the Kem C. Gardner Policy Institute (the University of Utah’s Bureau of Economic and Business Research). The index has become nationally recognized as a measure of regional economic specialization or diversity.
Hachman Index scores are normalized from 0 to 100. A higher score indicates more economic diversity, while a lower score indicates less economic diversity. According to a Hachman Index analysis, Utah’s industrial distribution is one of the most diverse in the nation (see Figure 1). The Hachman Index is not an exact measure, and because Utah and Missouri have near identical scores—96.9 and 96.8, respectively—it is not definitive that Utah is more economically diverse than Missouri.
Utah is not only a clear leader in the nation, but is also a standout in the West. Arizona, Colorado, and California are the only other western states to have scores above 90. Utah’s industrial composition is more diverse than the largest western states, including California, despite Utah having the 31st largest state GDP. California (1st), Colorado (19th), and Arizona (21st) all have larger economies than Utah.
Within Utah, the counties of Davis, Salt Lake, Washington, and Weber are the most economically diverse (see Table 1). Salt Lake, Davis, and Weber counties include three of Utah’s five metropolitan areas, and are three of the four largest counties in the state. Urban counties tend to have more diverse economies with a larger variety of economic opportunities and a wider range of industry sectors available to the population. Similarly, Washington County contains the St. George metropolitan area and is the most populated county outside of the Wasatch Front.
Access the full brief here. The next release of the publication will be in December 2019 with updated 2018 data.
DJ Benway is a research analyst at the Kem C. Gardner Policy Institute.
Figure 1: Hachman Index for States, 2017
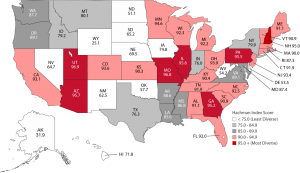
Source: Gardner Policy Institute analysis of U.S. Bureau of Economic Analysis GDP data
Table 1: Hachman Index Scores for Utah Counties, 2017
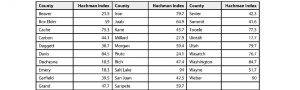
Source: Gardner Policy Institute analysis of Bureau of Labor Statistics (United States) and Utah Department of Workforce Services (Utah counties) employment data


