
Blog Post
Insight: Diversity in Utah’s Health Care Workforce
By: Levi Pace and Laura Summers
Note: The opinions expressed are those of the authors alone and do not reflect an institutional position of the Gardner Institute. We hope the opinions shared contribute to the marketplace of ideas and help people as they formulate their own INFORMED DECISIONS™.
Jun 22, 2021 – Data consistently show that many areas in Utah experience a shortage of health care workers, and most of Utah is a designated health professional shortage area.[i] Even in areas where health care professionals are accessible though, language and multicultural understanding can be barriers to individuals and families accessing appropriate services. To address these issues, several groups in Utah are looking for ways to increase interest and diversity in Utah’s health care workforce as part of larger initiatives to improve access to care.
The Gardner Institute recently released a Diversity in Utah Data Book―and after some initial conversations with different groups focused on workforce issues, we thought it might be helpful to further develop some of the data used in that book with a specific focus on diversity within Utah’s health care industry.
Our findings come from the U.S. Census Bureau’s American Community Survey,[ii] and cover a wide range of health care occupations, such as practitioners, support staff, and management.[iii] We hope that these data can complement other sources and be useful to groups seeking information to support the education, training, hiring, and retention of diverse talent in Utah’s health care occupations.
There are several ways to examine diversity in Utah’s workforce. For this analysis, we looked at how diversity in Utah’s health care workforce compares with other occupations, as well as all workers, by sex and racial and ethnic minority status. Not surprisingly, this broad view of health care occupations shows Utah’s health care workforce is disproportionately female (Figure 1). Health care workers are also less diverse than the rest of the state’s workforce, collectively (Figure 2).
Figure 1: Utah Health Care Workforce by Sex, 2015–2019
(Share of Workers in Occupation Category; Adults)
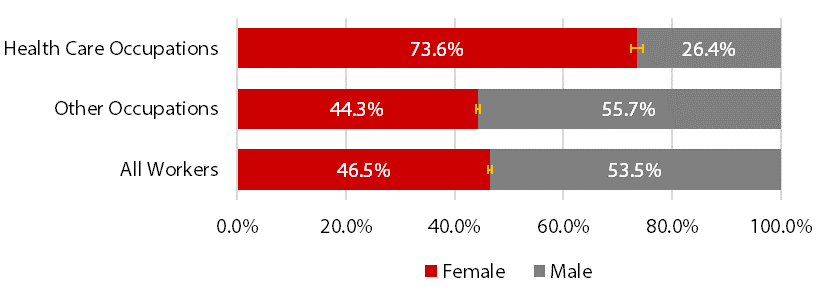
Note: American Community Survey uses binary sex categories. Error bars represent 90% confidence intervals around survey-based estimates. Differences between groups with non-overlapping error bars are statistically significant.
Source: Kem C. Gardner Policy Institute analysis of data from the U.S. Census Bureau, 5-Year American Community Survey, Integrated Public Use Microdata Series.
Figure 2: Utah Health Care Workforce by Racial and Ethnic Minority Status, 2015–2019
(Share of Workers in Occupation Category; Adults)
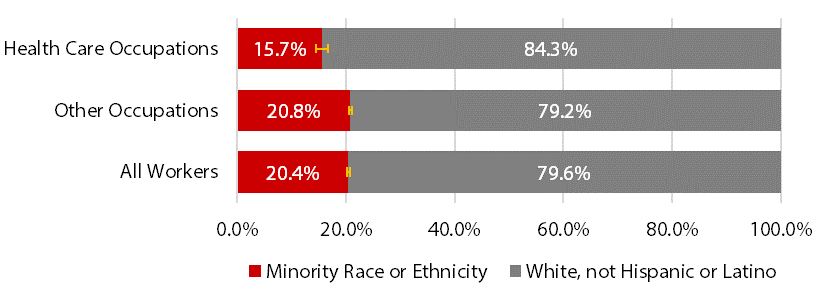
Note: “Minority Race or Ethnicity” includes people who are of Hispanic or Latino ethnicity or who identify as any race other than White. Error bars represent 90% confidence intervals around survey-based estimates. Differences between groups with non-overlapping error bars are statistically significant.
Source: Kem C. Gardner Policy Institute analysis of data from the U.S. Census Bureau, 5-Year American Community Survey, Integrated Public Use Microdata Series.
Figure 3 breaks down the data by minority racial and ethnic group. The share of Utah’s minority workers in health care occupations is not statistically different from their share in other occupations, except for people who are Black or African American, “Some Other Race,” or Hispanic or Latino. For example, the Hispanic or Latino group makes up only 8.6% of workers in health care occupations versus 13.5% in other occupations.
Figure 3: Utah Health Care Workforce by Minority Racial and Ethnic Group, 2015–2019
(Share of Workers in Occupation Category; Adults)
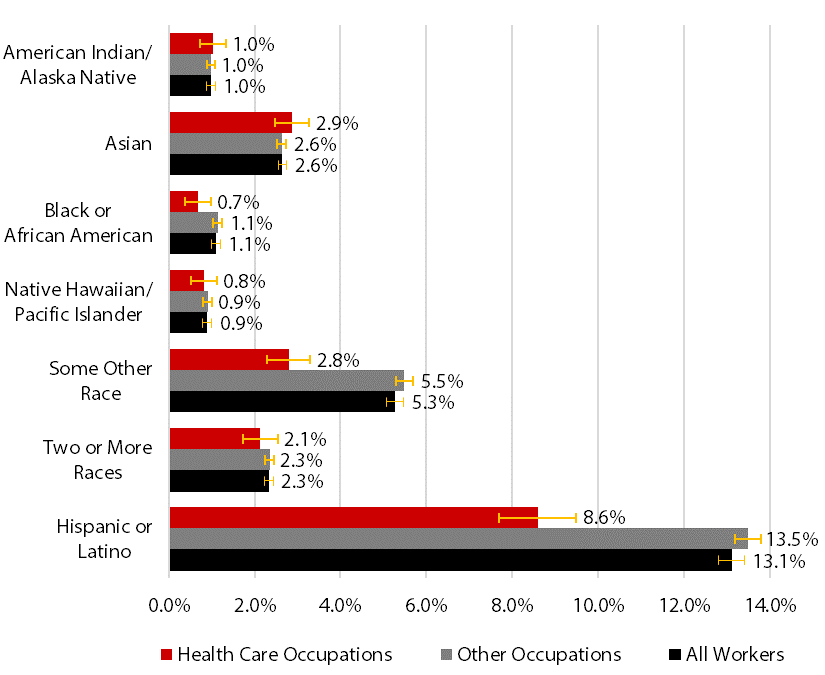
Note: Except for “Two or More Races,” race groups are not multiracial outside their group. Many people in the Census Bureau’s six minority race groups are also Hispanic or Latino, which the Census Bureau defines as an ethnicity. Error bars represent 90% confidence intervals around survey-based estimates. Differences between groups with non-overlapping error bars are statistically significant.
Source: Kem C. Gardner Policy Institute analysis of data from the U.S. Census Bureau, 5-Year American Community Survey, Integrated Public Use Microdata Series.
That said, the workforce shares represented by some of these races are notably small. American Indian or Alaska Native, Black or African American, and Native Hawaiian or Other Pacific Islander populations all make up 1.0% or less of the health care workforce. These groups also make up close to 1.0% of the working adult population.
Another way to view the data is by what percent of the adult workforce is employed in the health care sector. Figure 4 shows 7.7% of Utah’s adult workforce is employed in health care occupations. Slightly more than 12% of Utah’s adult female population works in health care, compared with just under 4% of males. Estimates for five demographic groups are not statistically different from the population average: American Indian or Alaska Native, Asian, Native Hawaiian or Other Pacific Islander, “Two or More Races,” and White, not Hispanic or Latino. Notably, only 5.9% of all minority races or ethnicities combined work in health care occupations.
Figure 4: Utah Population Shares for Health Care Occupations, 2015–2019
(People in Health Care Occupations as a Percent of Adult Workforce)
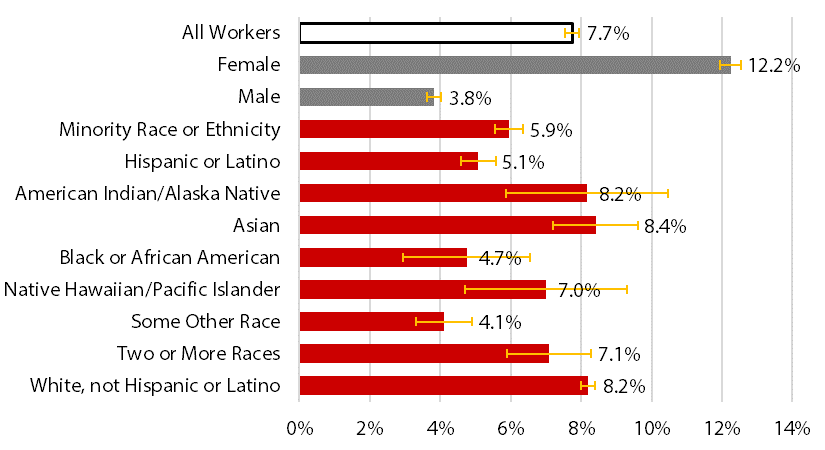
Note: “Minority Race or Ethnicity” includes people who are Hispanic or Latino or identify as any race other than White. The Census Bureau considers “Hispanic or Latino” an ethnicity and the subsequent groups as races. Except for “White, not Hispanic or Latino,” estimates include anyone who selected each race category, both “Hispanic or Latino” and not. Except for “Two or More Races,” race groups are not multiracial outside their group. Error bars represent 90% confidence intervals around survey-based estimates. Differences between groups with non-overlapping error bars are statistically significant.
Source: Kem C. Gardner Policy Institute analysis of data from the U.S. Census Bureau, 5-Year American Community Survey, Integrated Public Use Microdata Series
While the data presented above help highlight a complex issue in Utah, more information is needed to understand (1) the implications underlying these data, and (2) what decisions can improve diversity in Utah’s health care workforce and increase access to culturally and linguistically appropriate health care. Additional data that would be helpful include worker earnings, a breakdown by different occupations within the health care industry (e.g., health care practitioners versus support occupations), and geographic differences. That said, we hope these findings are helpful to different groups across the state focused on addressing Utah’s health care workforce issues.
Levi Pace is a senior research economist and Laura Summers is the senior health care analyst at the Kem C. Gardner Policy Institute.
[i]. More information on Utah’s shortage designations is available from the Utah Department of Health.
[ii]. The University of Minnesota provides American Community Survey (ACS) response data in its annual Integrated Public Use Microdata Series, IPUMS USA. Until November 2021, the latest IPUMS USA release goes through 2019. The ACS is a 1% annual sample. The five-year sample provides a clearer picture of specific demographic groups and occupations. From 2015 to 2019, participation included 83,028 adults who were employed in Utah, at the time of their survey response or within five years prior. Among ACS respondents, 12,653 were in minority racial or ethnic groups and 6,535 worked in health care occupations.
[iii]. We defined health care occupations using the Standard Occupational Classification system as codes 29-0000 (healthcare practitioners and technical occupations), 31-0000 (healthcare support occupations), and 11-9110 (medical and health services managers). We adopted U.S. Census Bureau definitions of demographic categories for sex, race, and ethnicity.


