
Blog Post
Insight: Census Bureau Releases 2021 Population Estimates and Components of Change for Counties, Metro and Micro Statistical Areas

By: Emily Harris
Mar 24, 2022 – The Census Bureau has just released its second set of products for the 2021 vintage: population estimates and components of change for all counties, metropolitan statistical areas, and micropolitan statistical areas in the United States.
Here at the Gardner Institute, we produce the Utah Population Committee (UPC) population estimates for Utah, but Census Bureau estimates give us the chance to compare Utah and its counties to other states and the nation. This is the first vintage of estimates that the Census Bureau has produced since the 2020 Census results were released, but they are also the first set of estimates that incorporate a full year of the COVID-19 pandemic. This makes all 2021 population estimates, produced by the Census Bureau, UPC, or any other agency, a bit unusual and, dare I say, mysterious.
To learn more about this data release, see our latest fact sheet.
The national press release highlighted four Utah areas – one county and three metropolitan statistical areas – for ranking in the top 10 nationally:
- Utah County had the tenth largest annual numeric increase, growing by 21,843 new residents from 2020-2021.
- St. George, Provo-Orem, and Logan metropolitan areas ranked first (5.1%), eighth (3.3%), and tenth (2.9%) highest annual percentage growth, respectively, from 2020-2021.
While Utah’s metro areas are typically featured in the percentage growth rankings, I have never seen a Utah county break the top ten for annual numeric increase. Utah falls in the middle of the pack population-wise among states, so the fact that Utah County experienced the 10th largest numeric increase out of all counties in the U.S. is remarkable.
Utah and Washington counties had the most growth within Utah, with 21,843 and 9,302 new residents, respectively, driving over half (55.3%) of statewide growth.
I know what you are thinking, “But what about Salt Lake County? Isn’t it the largest county in Utah? Shouldn’t it be one of the main drivers of state growth?” And yes, normally Salt Lake and Utah counties are the main drivers of population growth. However, the Census Bureau estimated that Salt Lake County experienced high net out-migration (-6,759) this year and only saw 0.02% growth since July 1, 2020, contributing almost no growth to the state.
This is highly unusual, but also falls within the narrative that the Census Bureau has provided this year: large metro areas and counties are seeing lower growth or declines while micro areas and medium sized counties are experiencing more growth than usual. It’s hard to say whether or not this estimate for Salt Lake County is accurate, but it sure gives us something to think about and investigate over the next year or so.
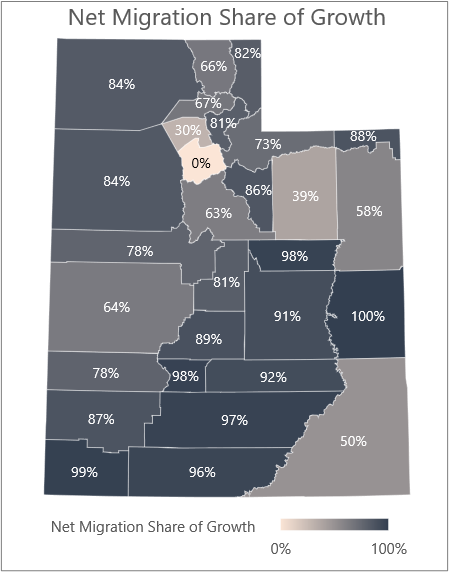
As seen nationally, net in-migration is the primary growth contributor to most of Utah’s counties this year. Utah’s fastest-growing counties, especially those located in Southwestern Utah and those surrounding the Wasatch Front, are experiencing most of their growth from net migration. However, two highly populated counties, Salt Lake and Davis, had more natural increase than net migration.
The 2021 estimates season has already been full of surprises, new trends, and exciting possibilities. Stay tuned for other Census Bureau estimates releases with subcounty geographies and more demographic detail coming your way in May and June.
Emily Harris is a Senior Demographer at the Kem C. Gardner Policy Institute.


