
Blog Post
Insight: Are Wages in Utah Keeping Up with Inflation?

By: James Wood
Note: The opinions expressed are those of the author alone and do not reflect an institutional position of the Gardner Institute. We hope the opinions shared contribute to the marketplace of ideas and help people as they formulate their own INFORMED DECISIONS™.
Apr 3, 2023 – Yes, surprisingly wages for most Utah workers have kept up with inflation. The average wage rate in Utah increased by 2.4% or $1,446 from the third quarter of 2021 through the third quarter of 2022 (Table 1). This increase adjusts for inflation using the Personal Consumer Expenditure (PCE) Price Index. When adjusting for inflation using the Consumer Price Index (CPI, the more commonly used measure), the average real wage increased at a slower rate of one-half of one percent, or $289 (Table 2). By either measure, however, the average wage for Utah’s nonagricultural workers kept pace with inflation over the 12-month period.[i]
For some workers, inflation has led to lower wages. The average wage in three sectors declined when adjusting wages by the PCE: (1) financial activities, (2) retail trade, and (3) information. The total employment in these three sectors was 325,094 jobs or 19% of nonagricultural employment. The largest decline was in the information sector, where the average wage fell by $9,403, from $111,651 to $102,249. In the retail sector, the state’s third largest employment sector, the average wage fell by $876 (a 2% decline). When adjusting by the CPI, the average wage declined in five sectors. These five sectors accounted for 672,406 jobs, or 40% of nonagricultural employment.
It is helpful to understand the differences between the Personal Consumer Expenditure Price Index and the Consumer Price Index. The PCE and the CPI are the two main measures of inflation.[ii] The Federal Reserve prefers the PCE, while the business community generally prefers the CPI. A short discussion of the differences between the two indices is outlined in the bullets below and clarifies how price changes are measured and why the indices can differ.
- The U.S. Bureau of Economic Analysis publishes the PCE, while the Bureau of Labor Statistics publishes the CPI.
- Typically, price changes in the two indices show little divergence; however, during periods of accelerating housing prices, the CPI produces higher rates of inflation (Figure 1). This divergence is due to the difference in the weight given to housing in the two indices.
- The PCE updates the weights assigned to items (health care, housing, food, etc.) every quarter, while the CPI updates item weights every two years (the BLS will move to annual updates of CPI item weights in 2023). More frequent updates capture the substitution effect of consumers as demand shifts due to product price changes. For example, consumers may shift from turkey to less expensive chicken during a run-up in turkey prices at Thanksgiving. The short-term effect of such substitution and change in consumer preference is captured in the more frequently updated PCE index.
- The CPI has a narrower scope, measuring purchases by urban consumers, while the PCE considers expenditures by both urban and rural consumers and purchases made by third parties on behalf of consumers. These third-party purchases, such as insurance companies that purchase prescription drugs for patients, means health care is weighted more heavily in the PCE. Limiting housing expenditures to urban consumers means housing is weighted more heavily in the CPI.
- Differences in the inflation rate between the two indices are primarily due to the scope of the surveys and the different weights assigned to consumer items.
Utah’s labor shortage has put upward pressure on wage rates. Although Utah’s pre-pandemic labor market was tight, the post-pandemic market is even tighter. The strong economic recovery in 2021-2022 left employers scrambling for workers as the unemployment rate fell to a low of 2.3% in 2022 (Figure 2). The shortage of workers required employers to pay more for new hires and increase the pay of existing employees. Since labor costs account for approximately two-thirds of the total cost of private businesses, rising wage costs produce cost-push inflation and higher prices for products and services. Higher labor costs, of course, are not the only cause of higher prices and inflation, but the recent strong wage growth nationally and in Utah is complicating the Federal Reserve’s effort to tame inflation.
You can’t have one without the other (usually). Inflation rates in the past 18 months have been the highest since the late 1970s and early 1980s when the average wage in Utah increased at an annual clip of 9.7% over a four-year period (I remember this time well, especially the 9% annual pay increases from the University of Utah). From 1977 to 1981, the average wage in Utah increased by 45%. What was true then and there is still true now and here, inflation and income go together “like a horse and carriage.”[iii] We shouldn’t talk about one without the other.
Table 1: Change in Wages by Employment Sector, Utah
(2021 wages adjusted by Personal Consumption Expenditure Index)
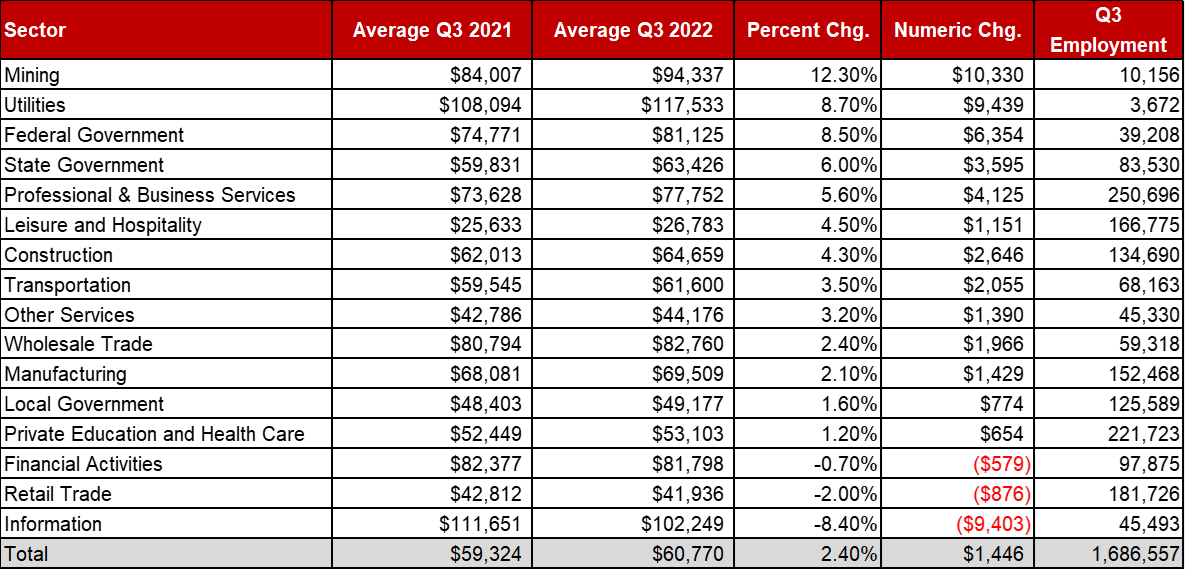
Source: Utah Department of Workforce Services, Quarterly Census of Employment and Wages and Bureau of Economic Analysis.
Table 2: Comparison of Change in Real Wages: Personal Consumption Expenditure Index vs Consumer Price Index
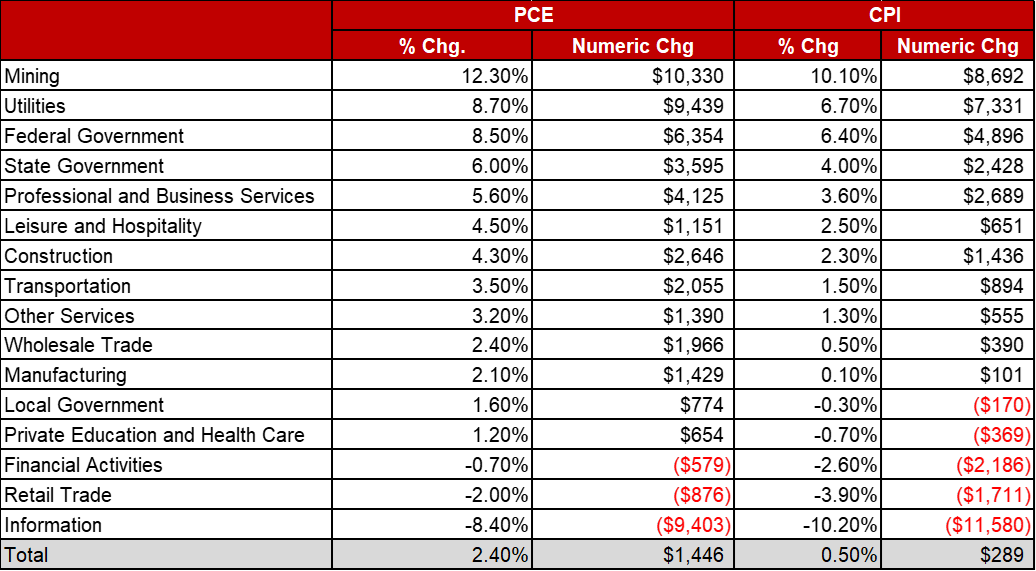
Source: Utah Department of Workforce Services, Quarterly Census of Employment and Wages, Bureau of Economic Analysis, and the Bureau of Labor Statistics.
Figure 1: Year-Over Percent Change in Consumer Price Index and Personal Consumption Expenditure Index
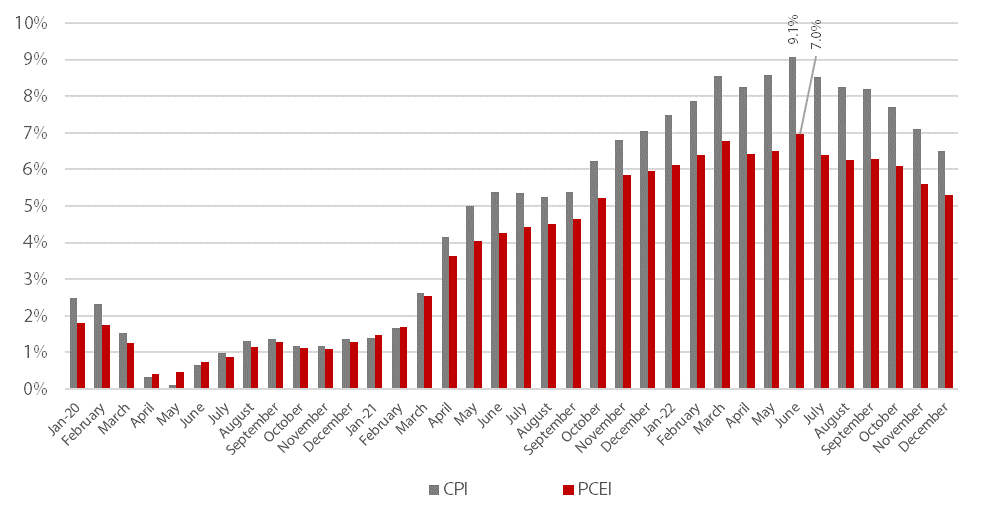 Source: Bureau of Economic Analysis and Bureau of Labor Statistics.
Figure 2: Unemployment Rate in Utah
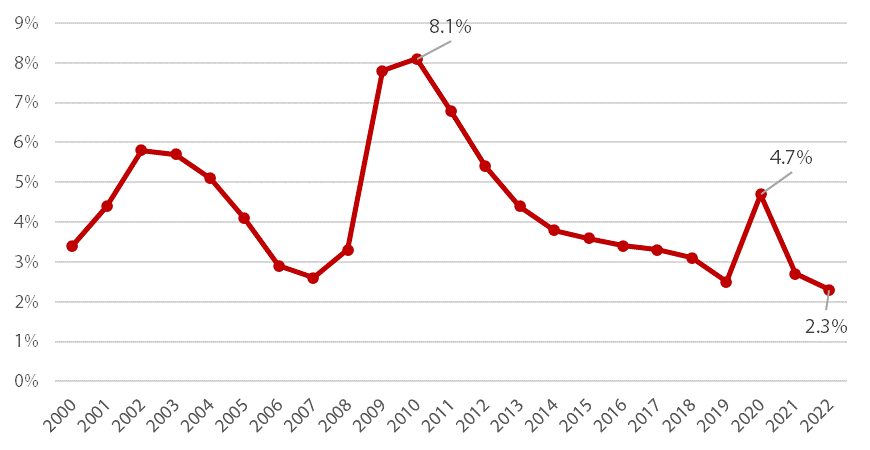 Source: Utah Department of Workforce Services.
James Wood is the Ivory-Boyer Senior Fellow at the Kem C. Gardner Policy Institute. He specializes in several research areas including housing, construction, real estate, and economic development.
[i] The wage data from the Bureau of Labor Statistics includes only covered employment, including employees covered by Unemployment Insurance. Consequently, wage data for a sole proprietorship, partners in a partnership, and self-employed are not included.
[ii] Core PCE or CPI were not used in the calculations. Core indices exclude energy and food from price change measures.
[iii] From the lyrics of the Sammy Cahn and Jimmy Van Heusen song “Love and Marriage” 1955, famously sung by Frank Sinatra.


