
Blog Post
Insight: Are Utah’s Wages Pacing with High Inflation?

By Natalie Roney and Phil Dean
Mar 23, 2022 – The COVID-19 pandemic and its economic repercussions continue to reverberate throughout the Utah and U.S. economies. In particular, labor shortages and high inflation remain top of mind for many Utahns as a return to “normal” economic conditions remains elusive. This post explores aspects of real (inflation-adjusted) wage indicators.
Various economic indicators provide a useful lens to analyze, interpret, and predict the state of the economy. While most provide value, each indicator also poses limitations. Some economic indicators may not tell the full story, particularly when an indicator’s multiple contributing factors are not equally considered. Although it takes more effort than a quick glance at a single indicator, considering a range of economic indicators is critical to truly understanding the economy. As discussed below, this is particularly true for real wage indicators.
High Inflation
For February 2022, the U.S. Bureau of Labor Statistics (BLS) estimates annual Consumer Price Index (CPI) inflation at 7.9% for the U.S. and at an even higher 9.7% for the Mountain region. While nominal wages increased over this period, businesses facing labor shortages and workers facing the continued real-world impacts of the highest consumer price inflation in four decades are thinking seriously about the impacts of high inflation on real (inflation-adjusted) wages.
Real Average Wages
A valuable economic indicator, real average wages is calculated using the U.S. Bureau of Economic Analysis (BEA) estimate of wages and salaries, divided by the BLS estimate of the number of non-farm workers, adjusted for inflation as measured by CPI. As Figure 1 shows, generally flat real average wages prevailed for the four-decade period between 1960 and the late 1990s (including during the high inflation of the 1970s and early 1980s), and have steadily increased over the past two decades. Figures 2 and 3 show real and nominal average wage changes on a year-over basis. During the fourth quarter of 2021, as shown by Figure 2, Utah experienced a 3.2% year-over drop in real average wages as inflation continued to rise. This represents one of the sharpest declines of real wages in Utah’s history.
While providing baseline economic context, this average overall wage indicator faces challenges that became evident during the pandemic. During the COVID-19 pandemic, businesses including restaurants, hotels, and entertainment venues shut down to slow the spread of the virus, causing many low-wage workers to become unemployed. Meanwhile, workers earning higher salaries in knowledge industries at places like financial institutions and tech companies kept their jobs throughout the pandemic by working remotely. As a result, average annual pay increased significantly during the pandemic, and as low-wage workers returned to the workforce and worked more hours, this moderating effect may mask wage increases that could be occurring for higher-wage workers. Due to this limitation, studying additional indicators can help in more deeply understanding real wages.
Figure 1 – Utah Quarterly Real Average Wage and Salary Disbursements
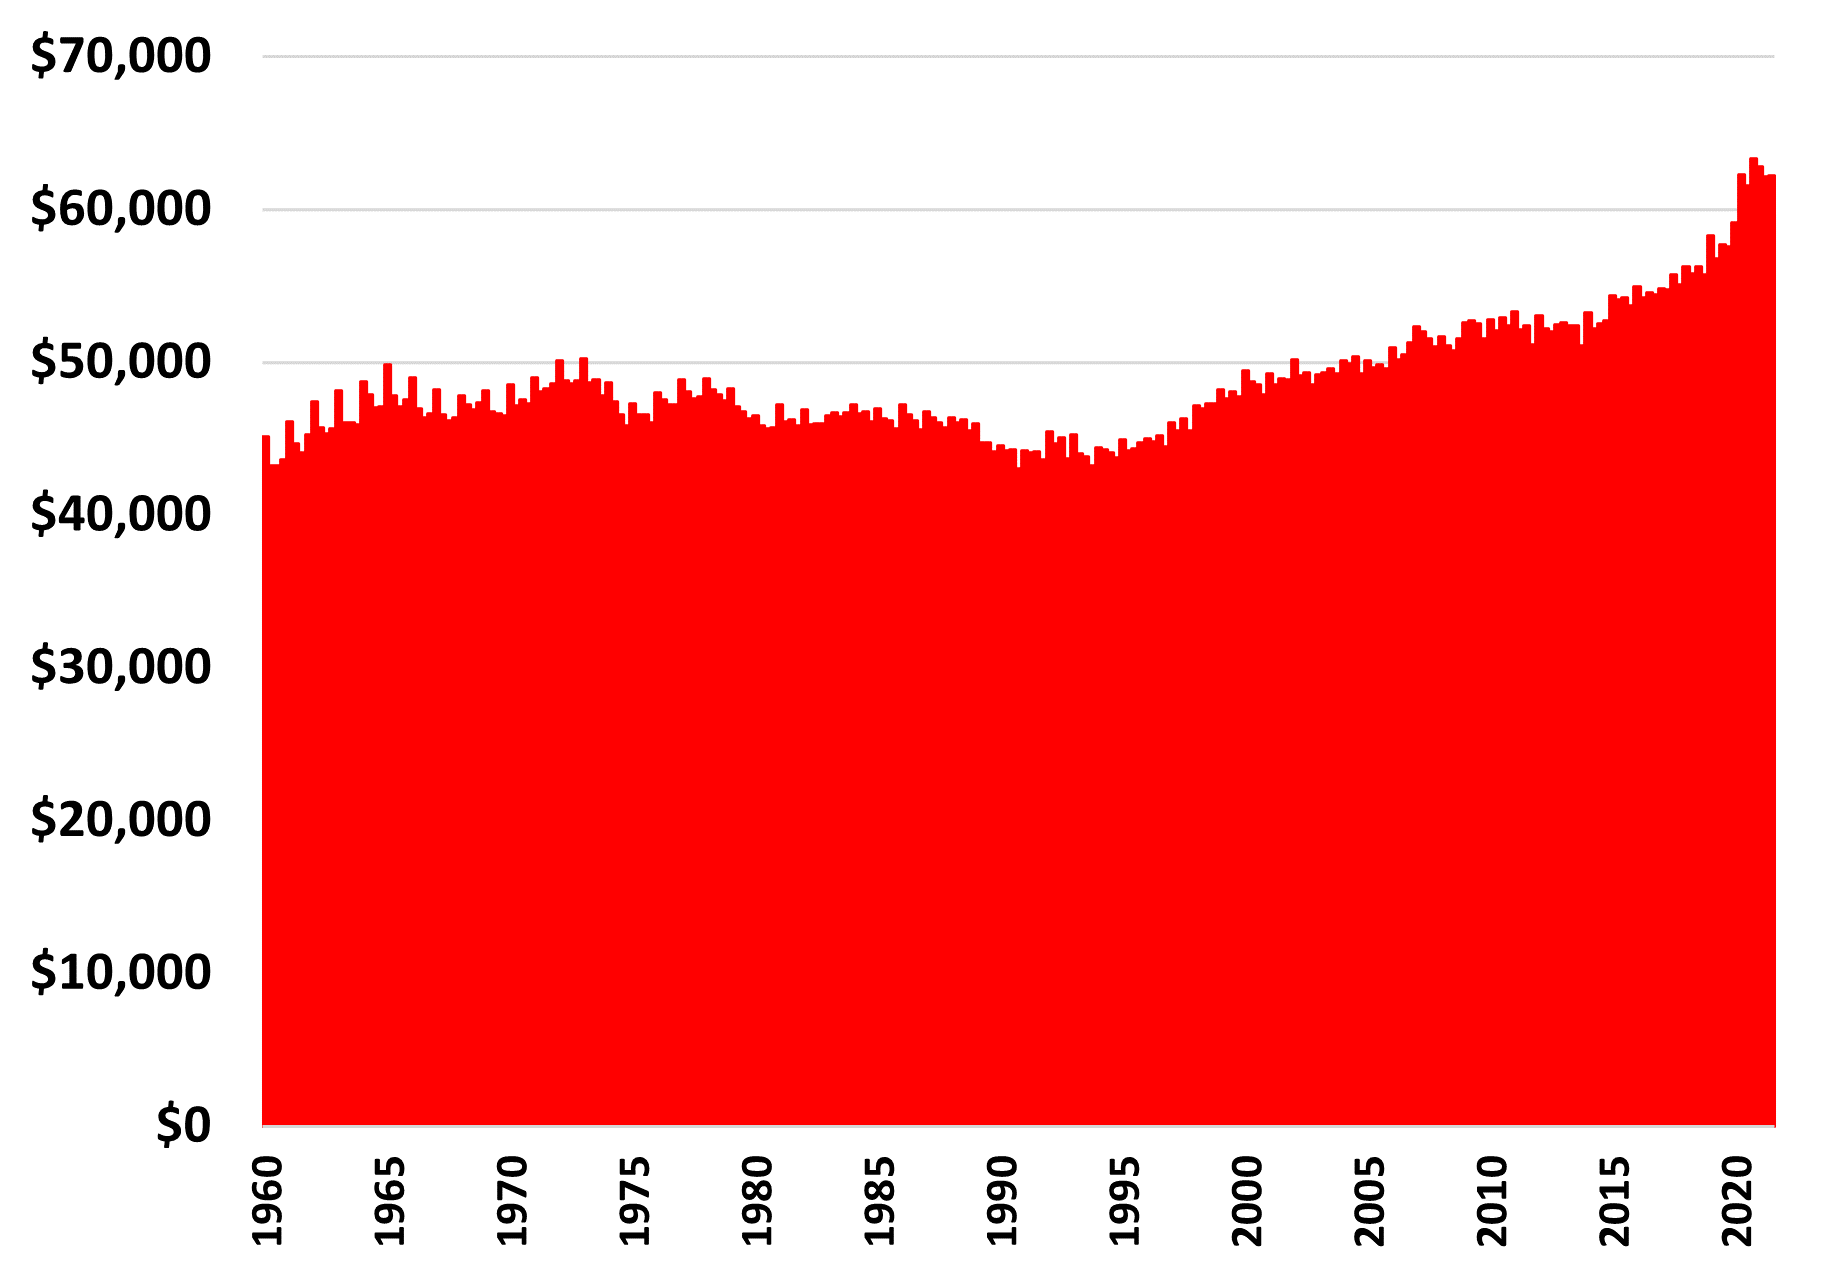
Source: Bureau of Economic Analysis and Federal Reserve Economic Data
Figure 2 – Utah and US Year-Over Change in Real Quarterly Wage and Salary Disbursements
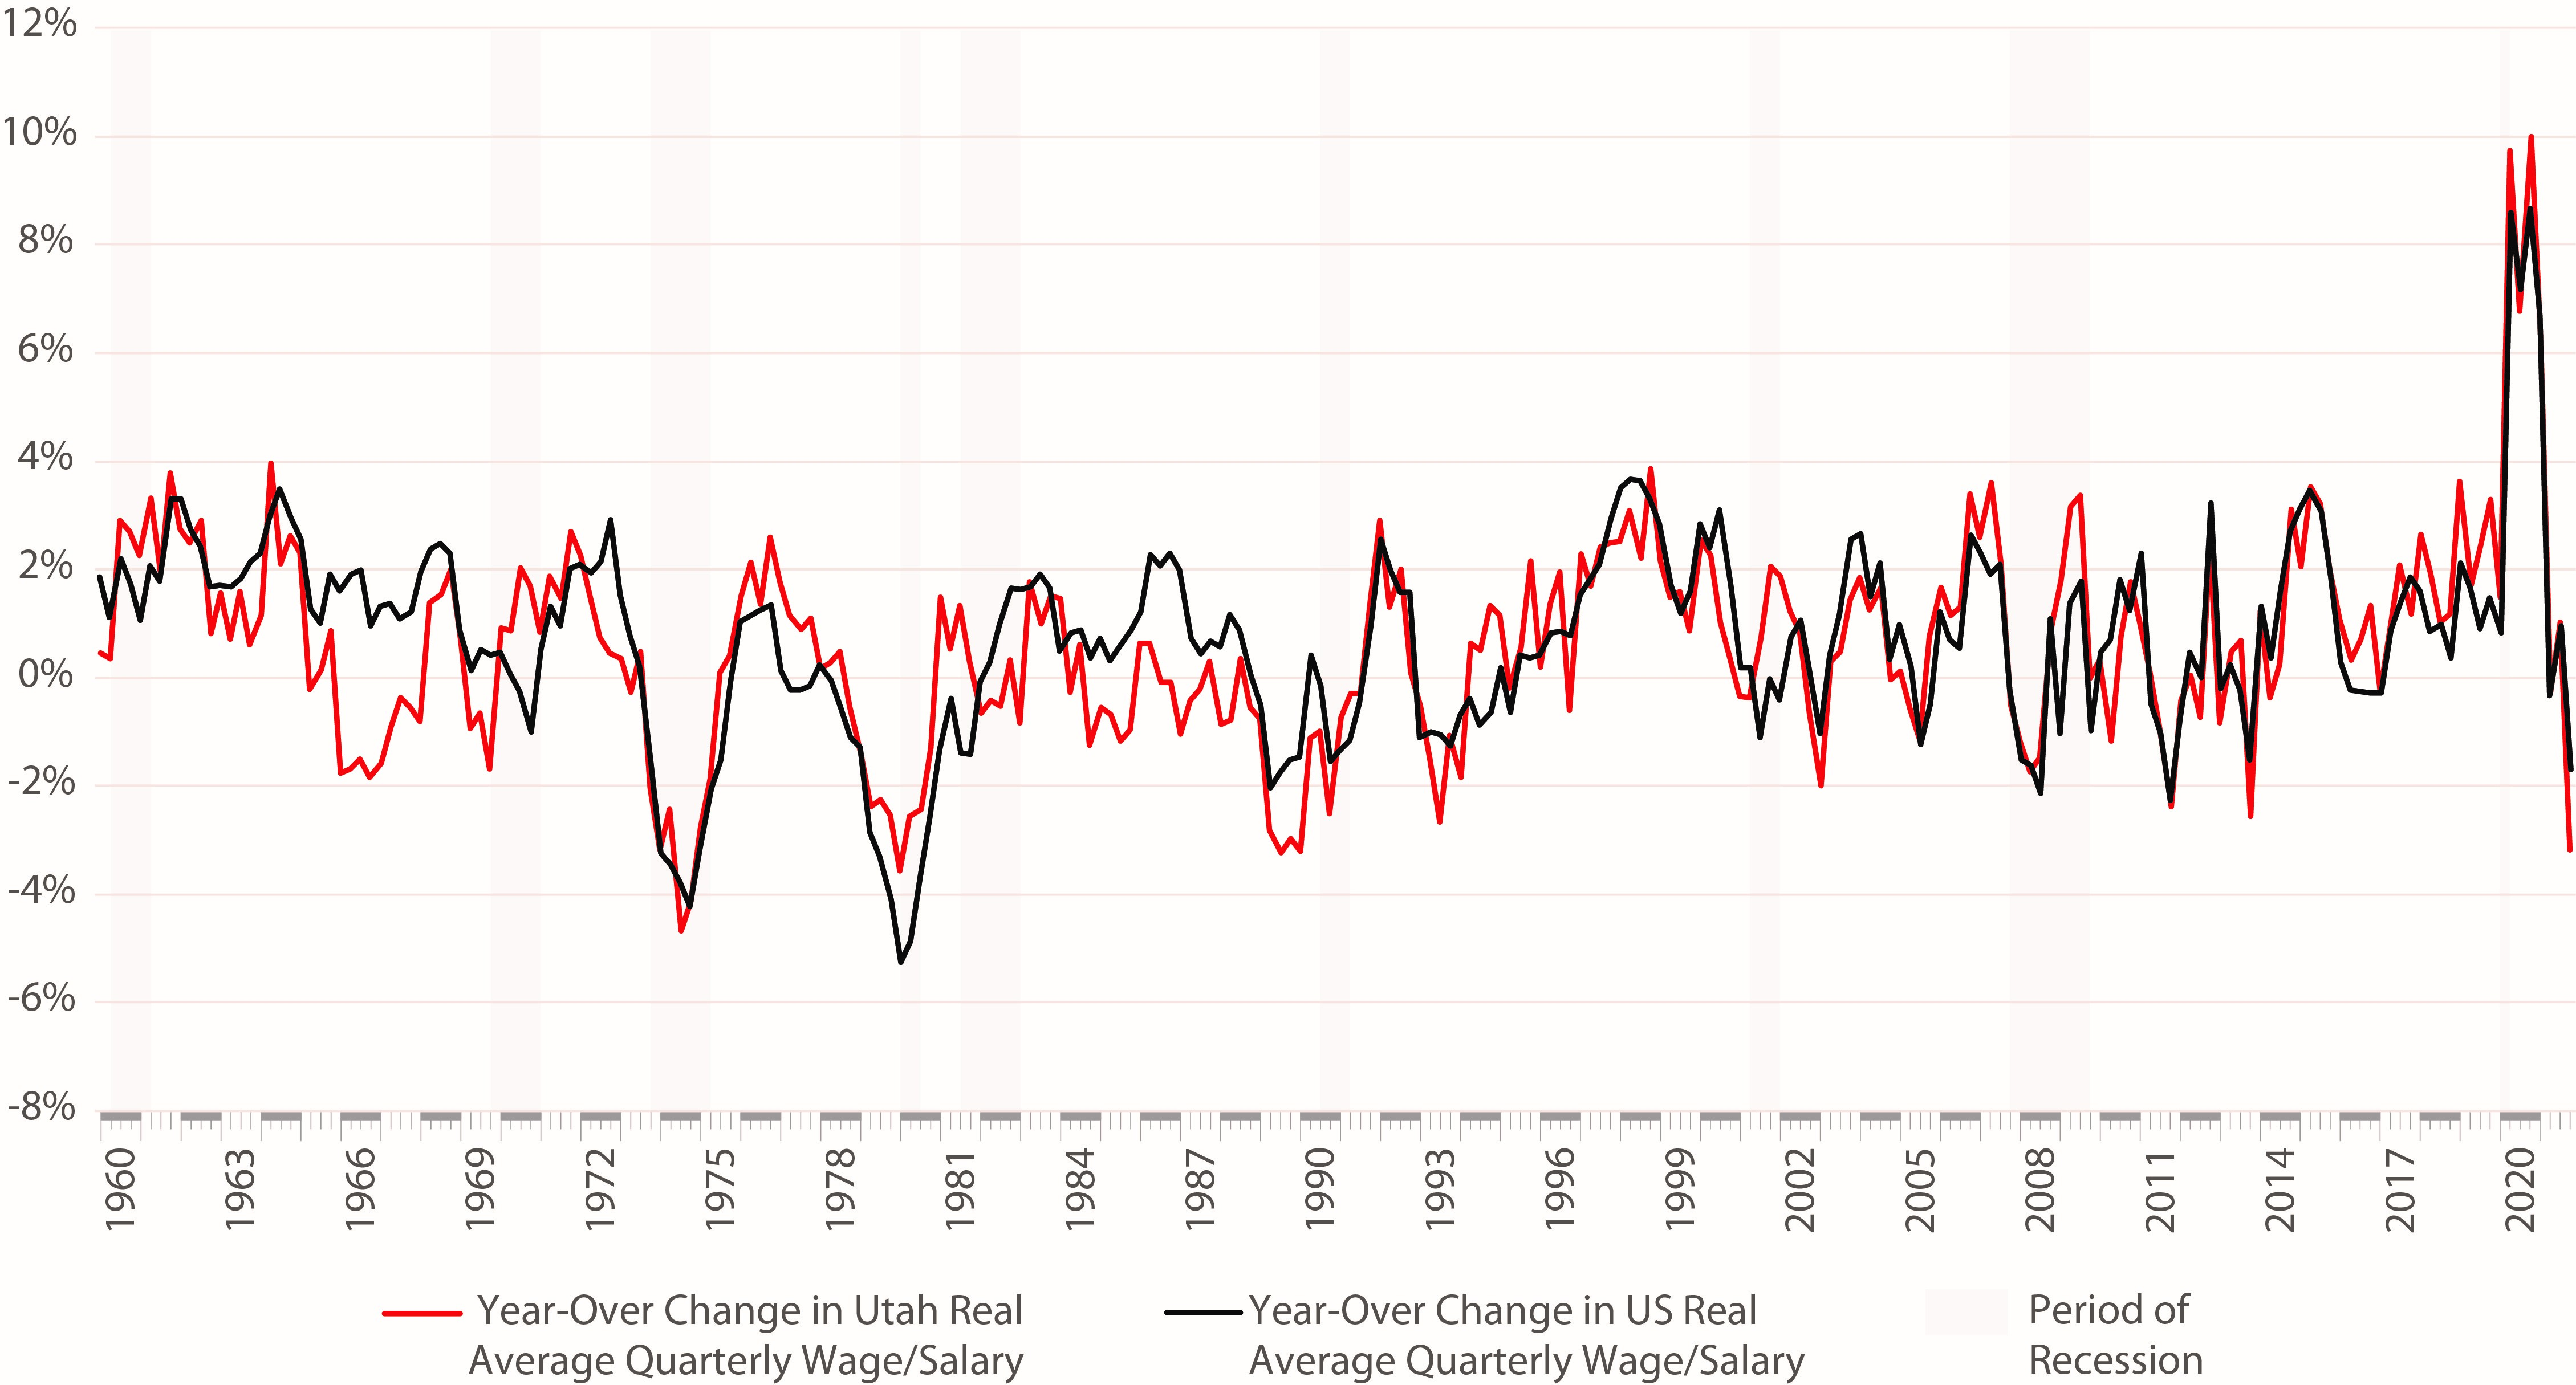
Source: Bureau of Economic Analysis and Federal Reserve Economic Data
Figure 3 – Utah and US Year-Over Change in Nominal Quarterly Wage and Salary Disbursements
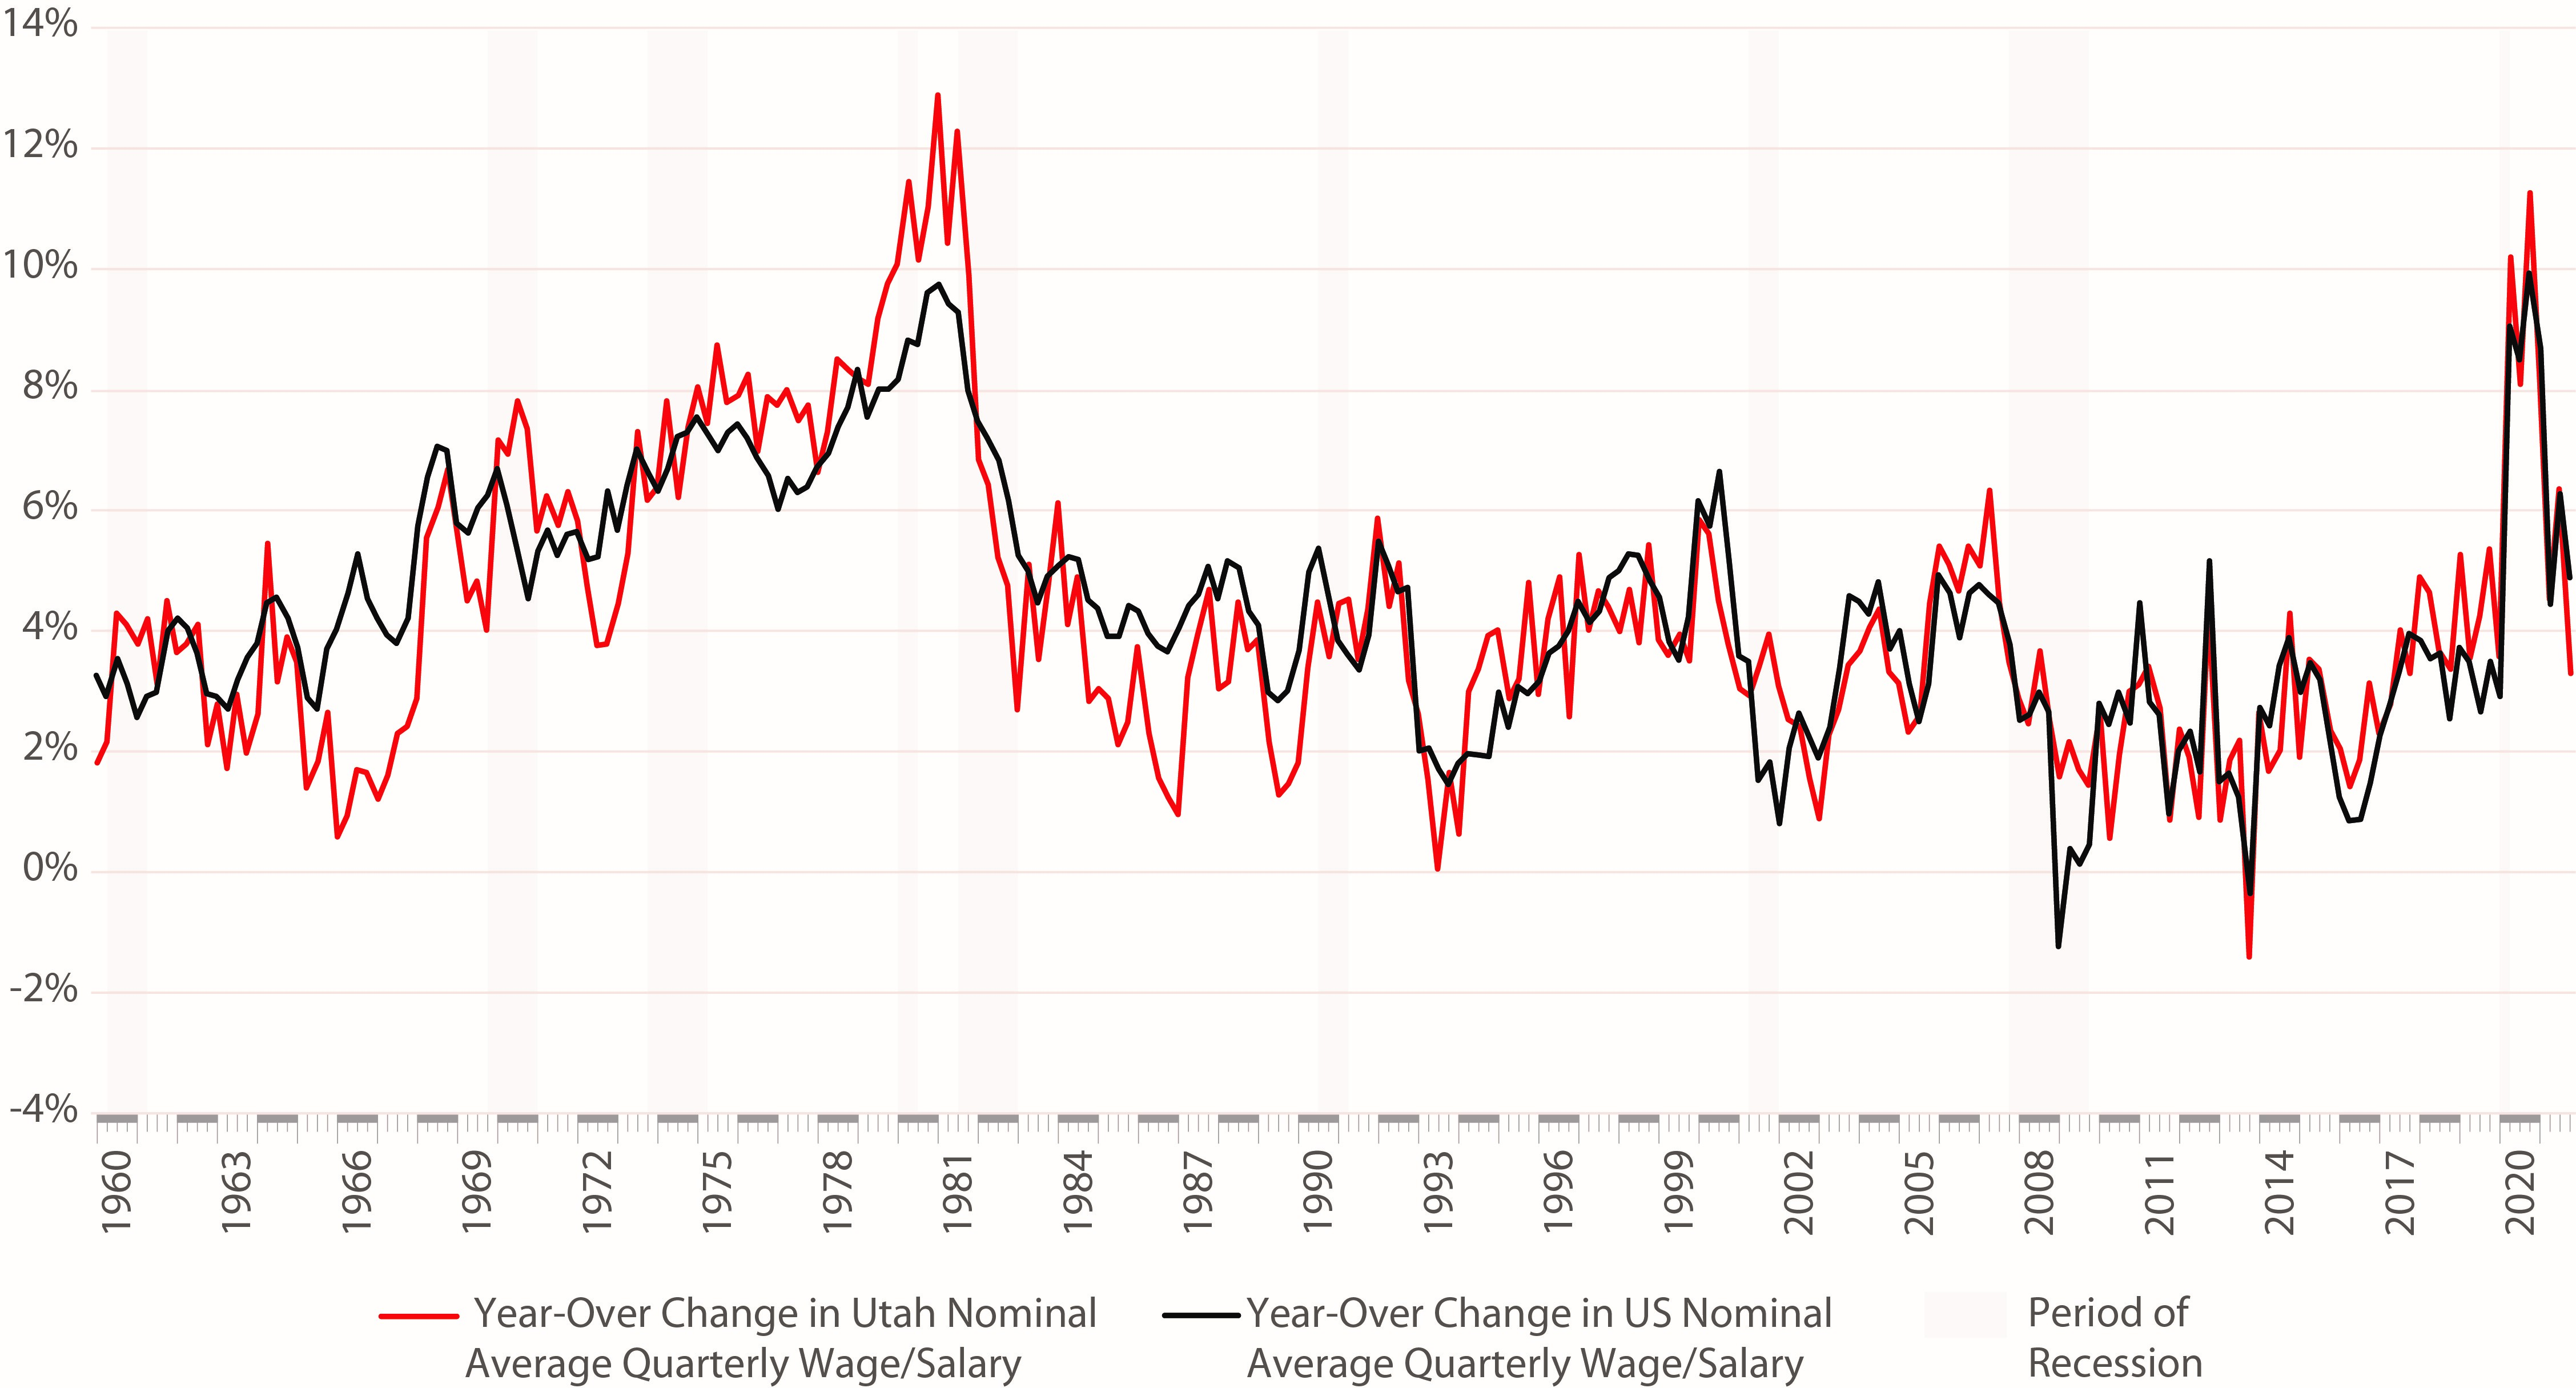
Source: Bureau of Economic Analysis and Federal Reserve Economic Data
Additional Wage Indicators
Real Average Hourly Earnings
Another commonly-used real-wage measure is BLS’ average hourly earnings. This data can be broken out in more detail, such as for all production and non-supervisory employees, and by sector such as construction, manufacturing, leisure and hospitality, and professional services.
As Figure 4 shows, this indicator shows real wage declines through 2021. While this measure also faces workforce composition challenges, it remains somewhat less sensitive to the number of hours worked than the average pay indicator, and the industry-level detail can help separate some of the workforce composition impacts.
This recent note by the Federal Reserve Bank of Dallas discusses workforce composition effects on the average hourly earnings indicator. It adjusts for workforce composition for the U.S., finding slight real wage declines in the second half of 2021, but real wage increases throughout the pandemic.
Figure 4 – Comparison of Year-Over Change in Utah Real Overall Average and Hourly Wages
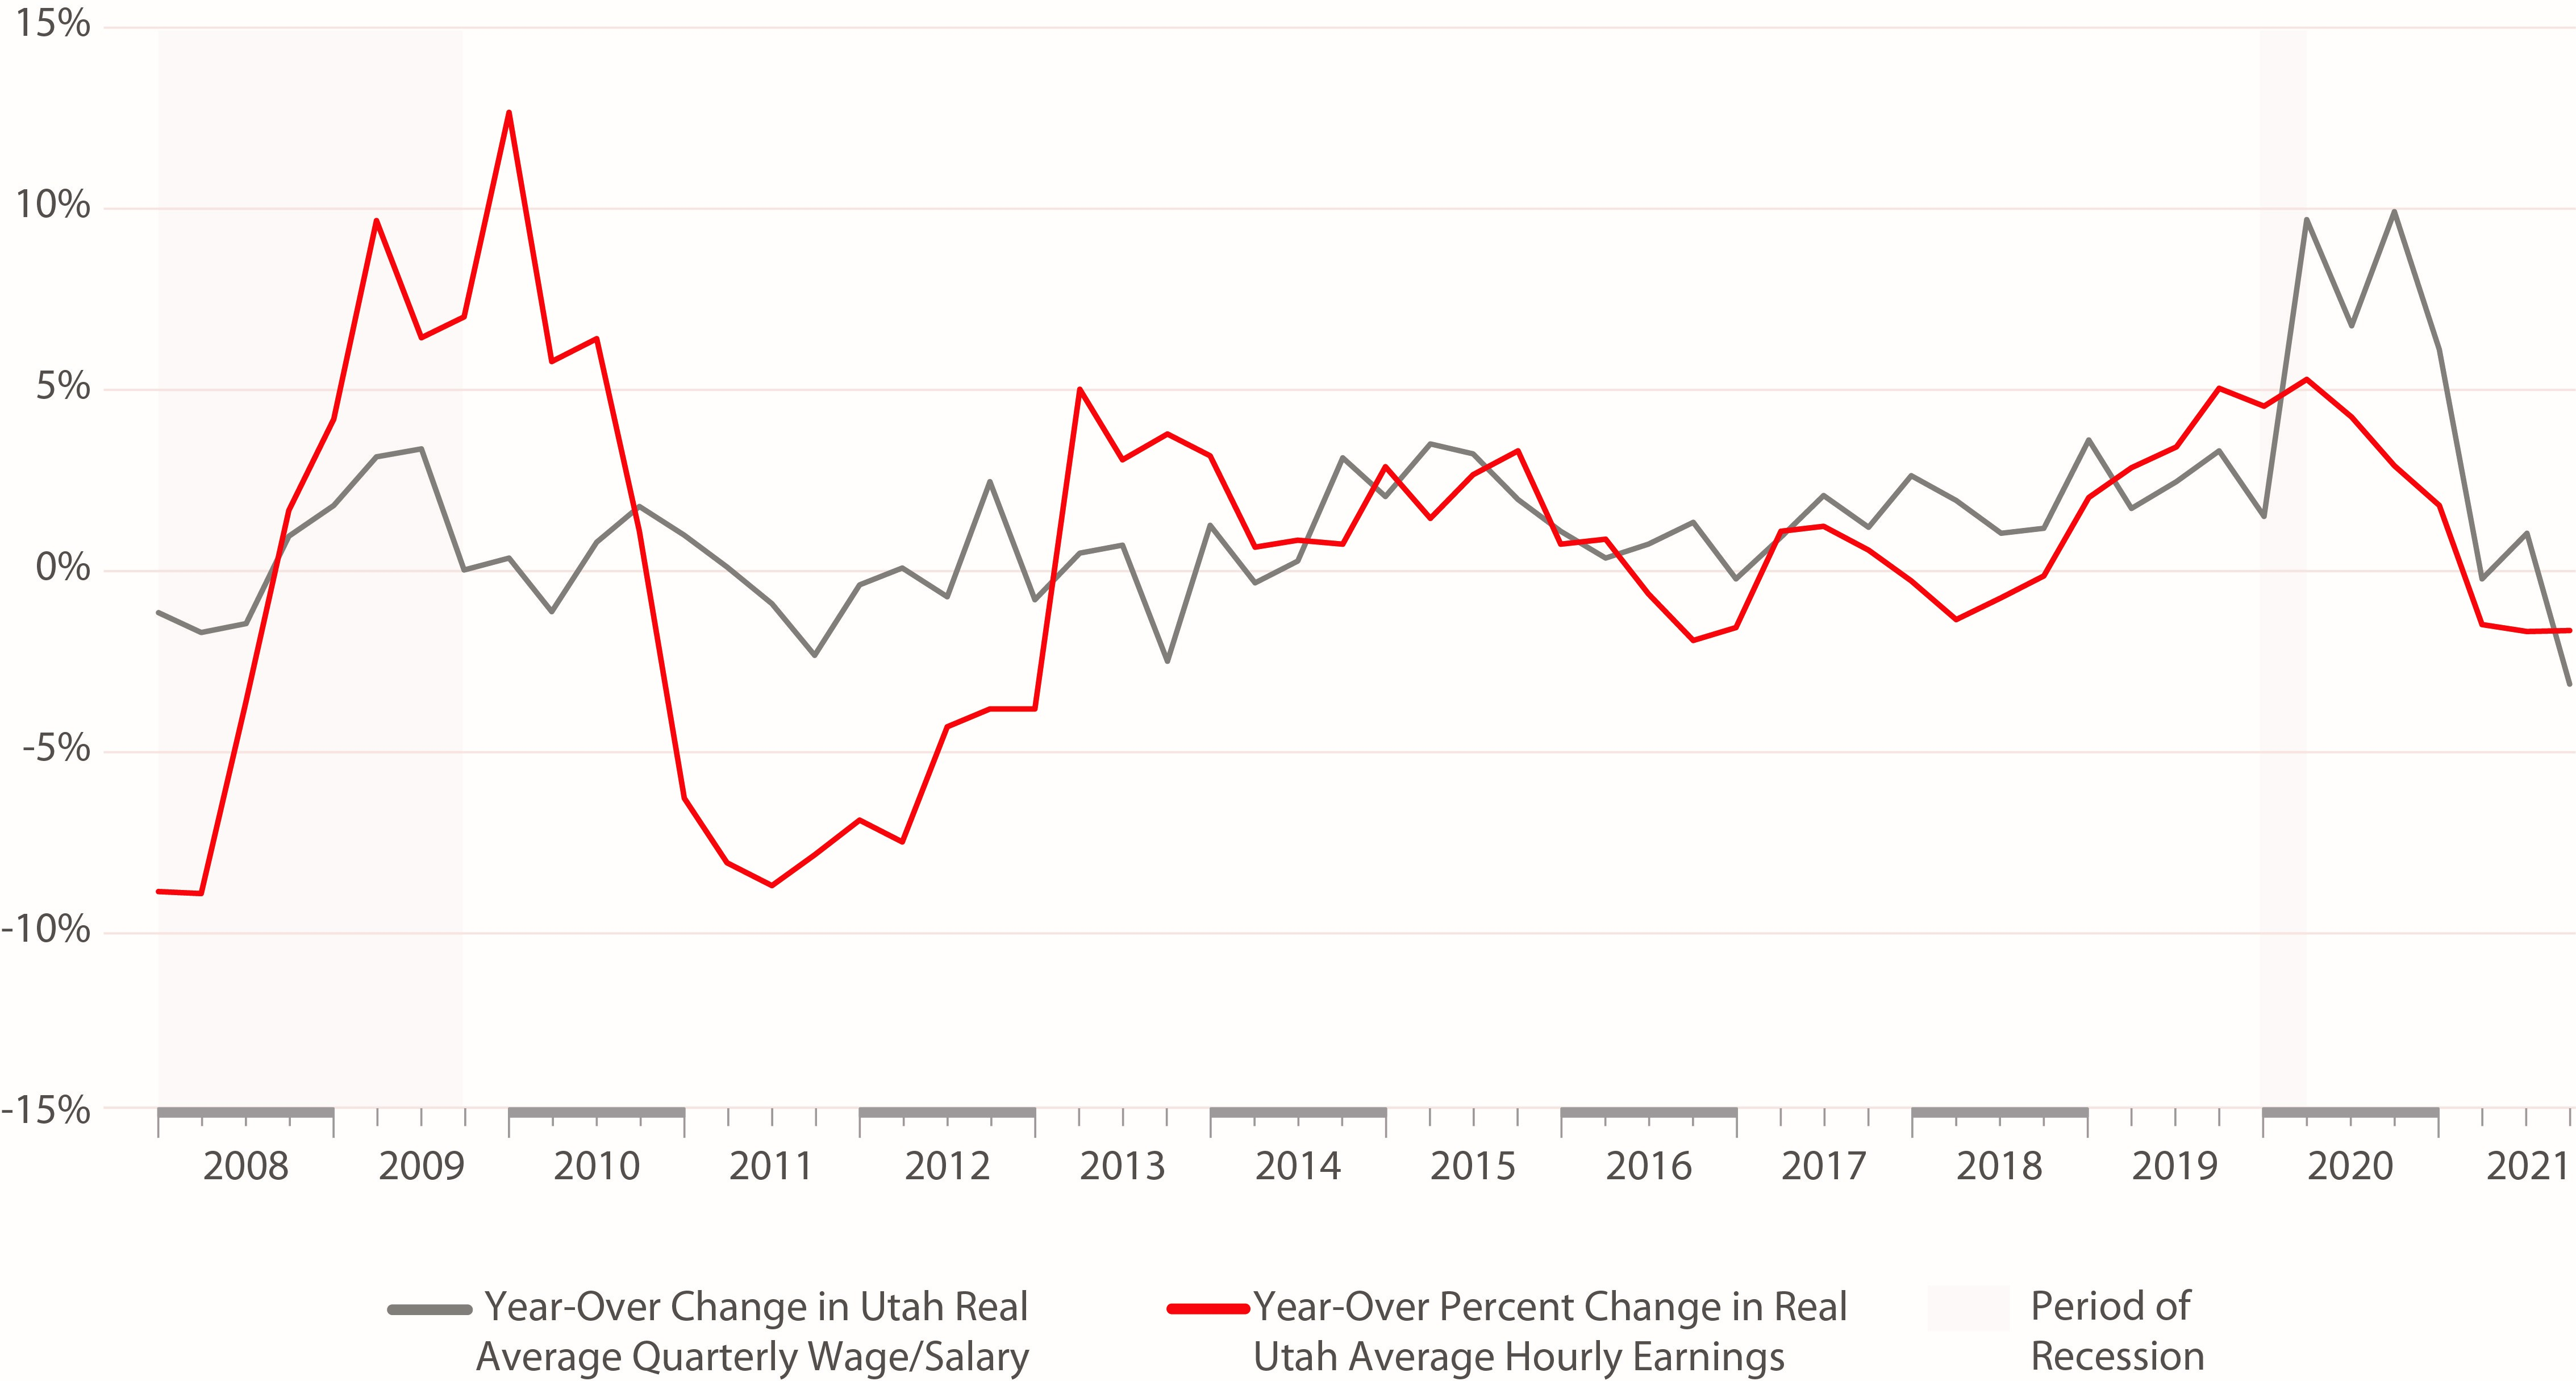
Source: Bureau of Economic Analysis and Federal Reserve Economic Data
Income Level Analysis
The Pew Research Center recently released a study showing the pandemic’s effects on income inequality by breaking down average wages by quintile and by including wages of unemployed workers. This analysis shows how the pandemic heavily impacted low-wage workers. During the second quarter of 2020, Pew calculated the median income for the lowest quintile of earners, including unemployed workers, as $0. Breaking the data apart this way shows clear discrepancies between low-wage earners and those with higher salaries and is another useful tool for understanding wages during the pandemic.
Occupation or Industry
Another analysis, conducted by the Roosevelt Institute, observes wage trends based on occupation. Similar to Pew’s approach, this method singles out low-wage workers to clarify this group’s wages during the pandemic. Using real wages, the analysis finds that as of October 2021, low-wage workers’ wages continued to pace with inflation. Understanding the pandemic’s effects on workers in occupations or industries that were hit the hardest during COVID-19 can help determine whether or not wages have kept up with inflation for all workers or for subsets of workers.
Other Data Sources
Several other useful data sources for examining Utah and national wage levels include the following:
- Employment Cost Index (ECI) – wages and salaries for private industry workers (https://fred.stlouisfed.org/series/ECIWAG)
- Real weekly earnings of full-time employees (https://fred.stlouisfed.org/series/LES1252881600Q)
- Federal Reserve Bank of Atlanta wage tracker (https://www.atlantafed.org/chcs/wage-growth-tracker)
- Utah DWS annual wage data (https://jobs.utah.gov/wi/data/library/wages/annualprofilewages.html)
Conclusion
By investing the time needed to better understand real wages in general and in their own particular industry, workers and employers can become better informed as they make critical compensation decisions. Each macroeconomic indicator brings its own strengths and weaknesses, but reviewing a range of indicators enhances understanding.
Natalie Roney is a graduate assistant at the Kem C. Gardner Policy Institute.
Phil Dean is the public finance senior fellow at the Kem C. Gardner Policy Institute.
Note: The opinions expressed are those of the author alone and do not reflect an institutional position of the Gardner Institute. We hope the opinions shared contribute to the marketplace of ideas and help people as they formulate their own INFORMED DECISIONS™.


