
Blog Post
Insight: A Note on Utah’s Vacant Housing Stock

By: Dejan Eskic
Note: The opinions expressed are those of the author alone and do not reflect an institutional position of the Gardner Institute. We hope the opinions shared contribute to the marketplace of ideas and help people as they formulate their own INFORMED DECISIONS™.
May 27, 2021 – For the better part of the last decade, housing demand in Utah has far outpaced its supply. The term “housing shortage” or “housing gap” is ingrained in our everyday lexicon. Utah’s estimated housing gap in 2020 is 44,500.[i] This gap, combined with strong economic growth and historically low interest rates, has pushed prices to new highs, bringing new affordability challenges to all incomes.[ii] The economic challenges resulting from the pandemic have created a very competitive and unhealthy housing market, leading to a drop in existing for-sale supply and further exacerbating housing challenges in our state and the nation.[iii]
The housing shortage is further evident in the below 5% apartment vacancy and single-digit days-on-market of existing homes for sale.[iv] Additionally, the months of supply for both new and existing homes for sale sit at less than one month. In other words, if no new supply came on the market today, we’d sell out of everything currently for sale in less than a month.
U.S. Census Bureau housing statistics show Utah had 109,688 vacant units in 2019, significantly higher than the housing gap. The number of vacant housing units for Utah has ranged from 101,000 to 111,000 over the last decade (see Figure 1). From 2010 to 2019, vacant units grew at an annual rate of 0.8% in the state. While the number of vacant units has increased over the last decade, the vacancy rate has declined. The Census Bureau vacancy rate in the state was the highest in 2011 at 11.0% and has trended down to 9.7%.
Figure 1: Vacant Housing Units and Vacancy Rate in Utah, 2010–2019
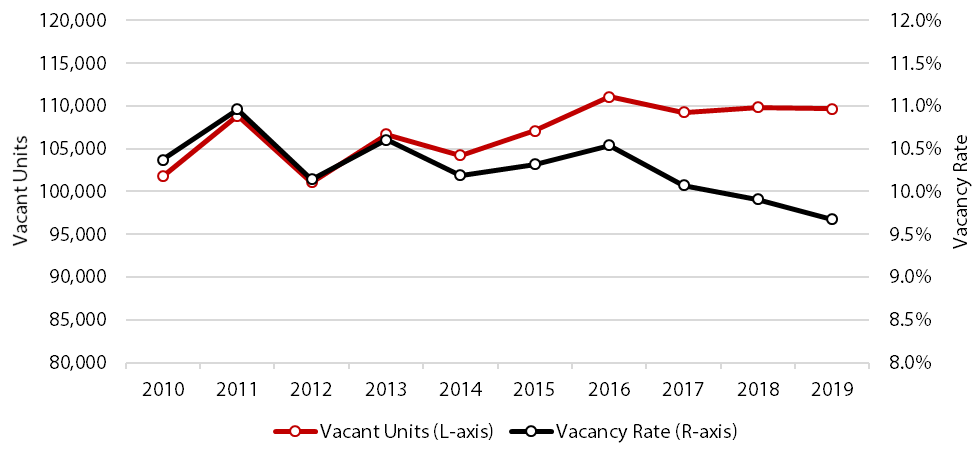
Source: U.S. Census Bureau, American Community Survey 1-Year Data
So, what to make of all these vacant units? In reality, Utah does not have 109,688 vacant units that compete in the market. The way the market views vacancy is slightly different from the Census. The Census Bureau has several classifications for vacant homes.[v]
Seasonal, recreational, or occasional use includes units intended for occupancy only during certain seasons of the year and are found primarily in resort areas. This category accounts for 46.6% of vacant units over the last decade (see Figure 2) and is heavily concentrated in state tourist areas such as Summit County and southern Utah (see Figure 3). From 2010 to 2019, this category increased 13.6%, adding 6,245 units statewide. This growth also accounts for only 3.0% of total units built during the same period.
The vacant units that are for rent, for sale, and rented or sold, but not occupied, account for 33.0% of the vacant units over the last decade. In 2019, 63.9% of vacant units in this category were located in the four Wasatch Front counties (see Figure 3). From 2010 to 2019, this category decreased 7.2%, a decline of 2,819 units.
The “other vacant” category includes 11 different reasons for the vacancy: units held for personal reasons where the owner does not want to sell/rent, those in need of repair, being repaired, in foreclosure, for storage, in legal proceedings such as the settlement of an estate, extended absence, preparing to rent or sell, possibly abandoned or condemned, specific use housing for groups like the military or student dorms, or unknown reasons. The other vacant category accounts for 20.0% of the vacant units over the last decade. In 2019, 57.2% of the vacant units in this category were concentrated in the four Wasatch Front counties (see Figure 3). From 2010 to 2019, this category increased 26.0%, adding 4,303 units.
Figure 2: Vacant Housing in Utah by Vacancy Type, 2010–2019
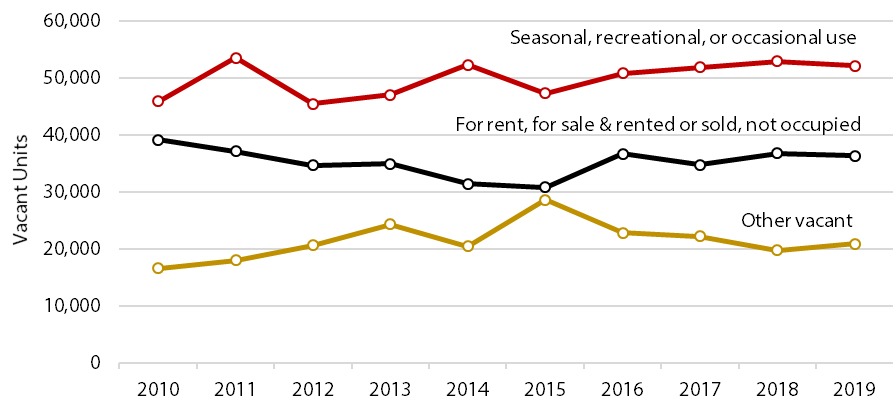
Source: U.S. Census Bureau, American Community Survey 1-Year Data
Figure 3: County Shares of Utah’s Vacant Housing Units by Vacancy Type, 2019
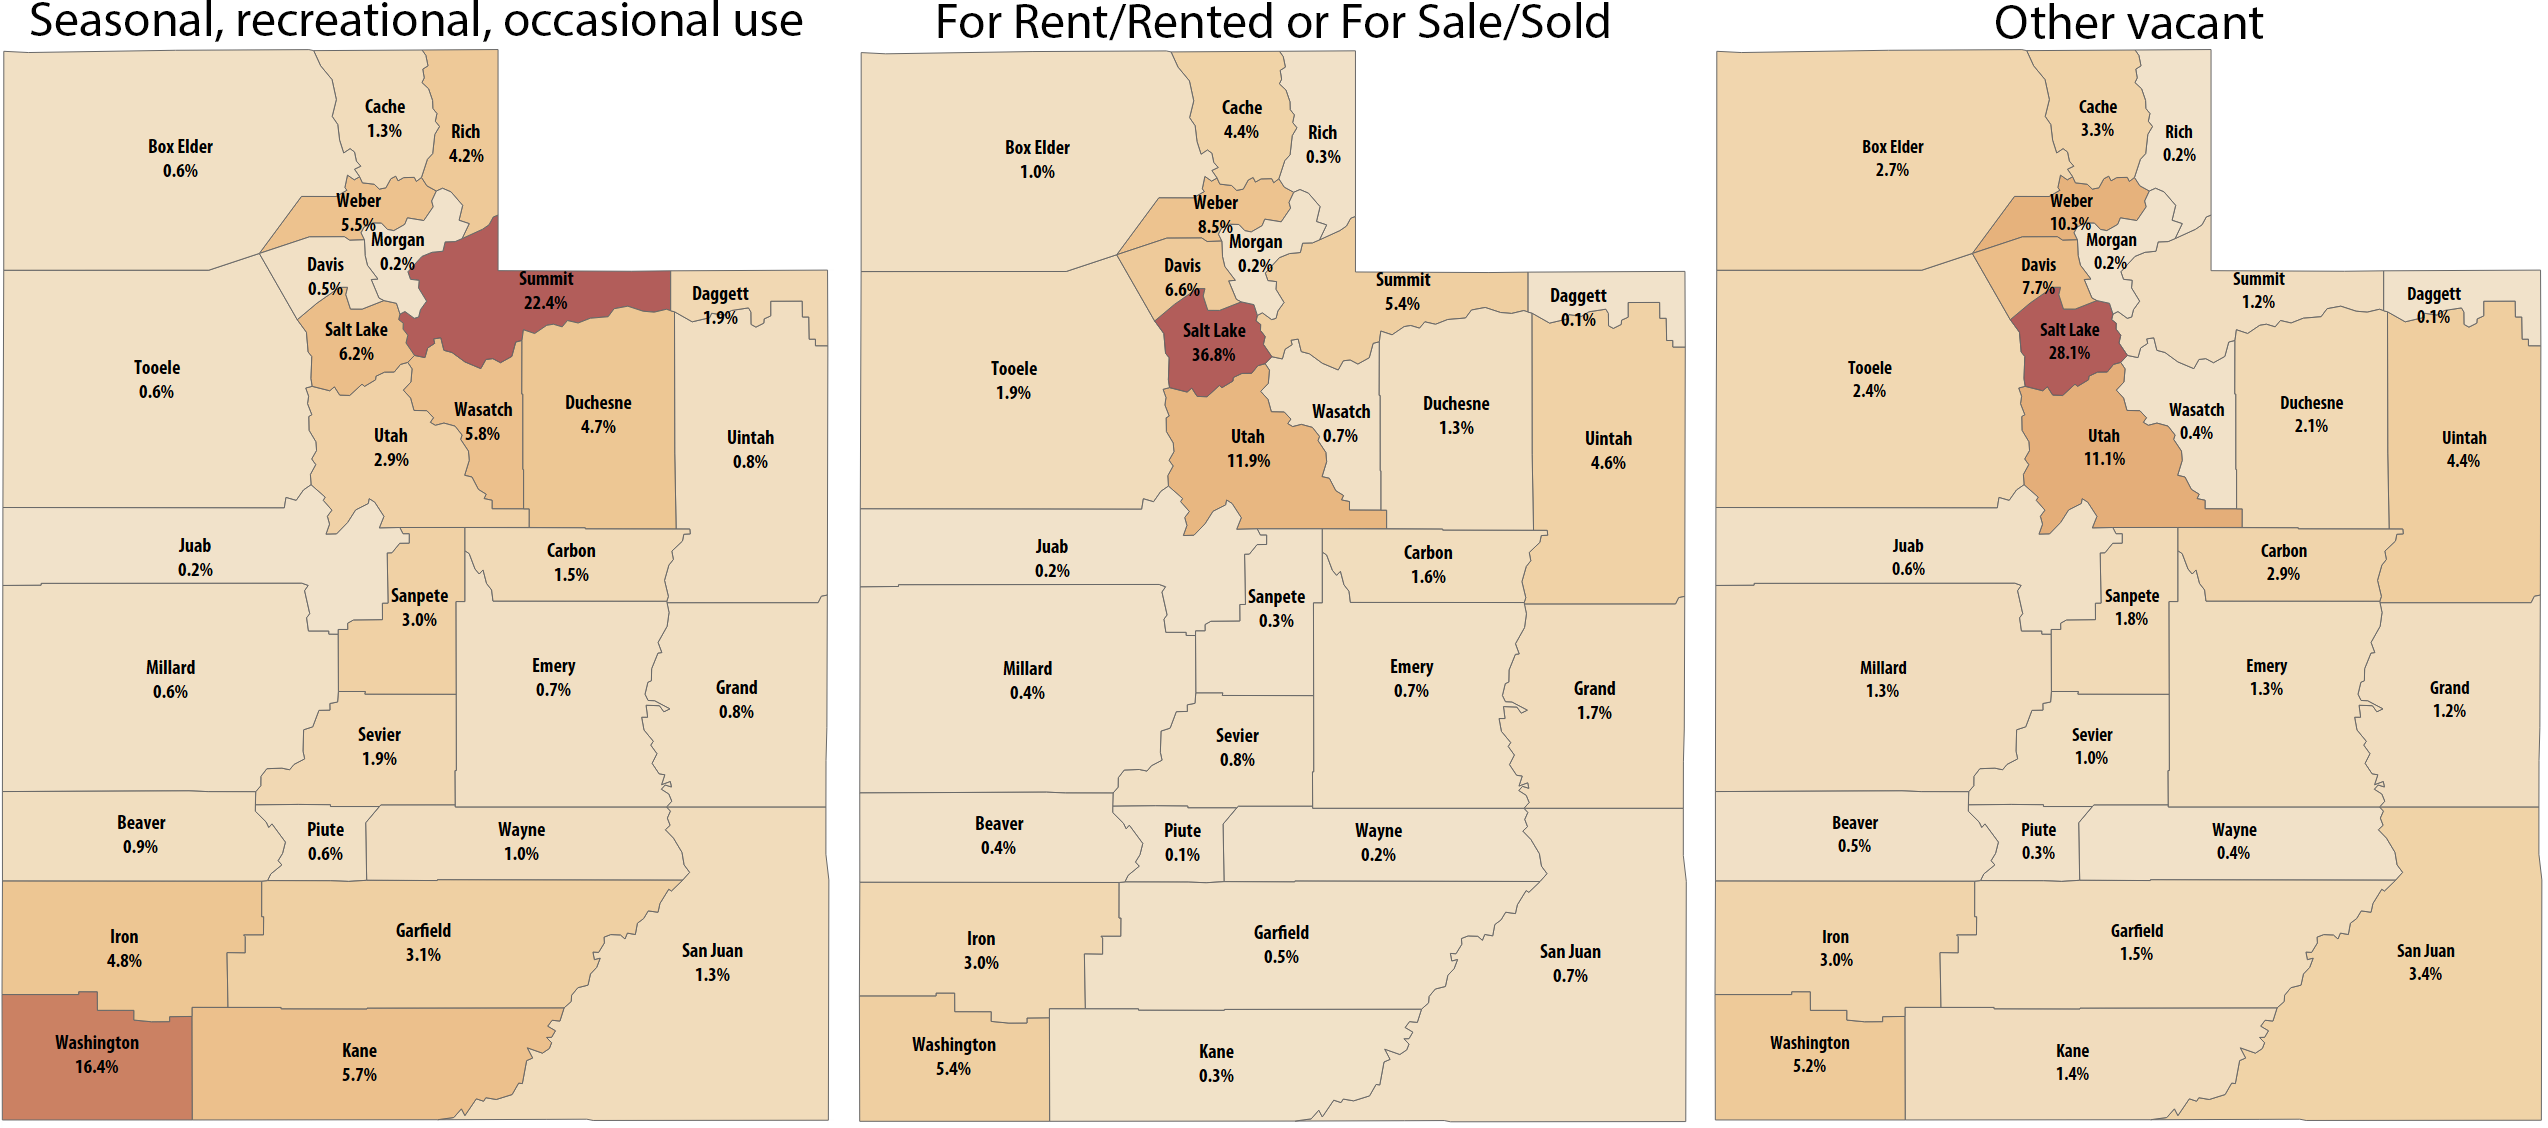
Source: U.S. Census Bureau, American Community Survey 1-Year Data
Translating vacancy categories from the Census Bureau to how the marketplace views vacancy is essential to understanding housing market dynamics, especially supply. It’s fair to assume units that are in the process of renting or selling are actually vacant but are expecting occupancy. Would-be occupiers leave behind their previous unit, which then becomes vacant, and move into a new one. This type of vacancy is healthy, makes up the actual residential marketplace, and these units are accessible to buyers and renters.
Units classified as seasonal, recreational, or occasional use aren’t necessarily viewed as vacant by the market. They aren’t available for sale or rent and are periodically occupied by persons with usual residence elsewhere. It is debatable whether these units would even exist if they were intended for other purposes. However, in urban areas, these units could have an impact on the housing stock, albeit minimal. The growth of units in this category has been relatively slow over the last decade. It is also important to note that housing units in this category are heavily concentrated in the recreational and rural areas of the state and consist of units classified as cabins/recreational.
Housing units classified as other vacant include 11 different explanations for the vacancy. Units that are being repaired or in need of repair are likely to enter the market once repairs are completed. Units that are held for personal reasons where the owner doesn’t want to sell/rent or units that are vacant because they’re used as storage could likely bring new supply to the market. While data isn’t available at the state level for these explanations, national data show that in 2019, these two categories accounted for 36.1% of the other vacant category.[vi] Applying this share to Utah’s 20,823 other vacant units yields 7,517 units, accounting for approximately 2.5 months of new construction.
The type of vacant units that can effectively accommodate current demand and reduce supply stress in the market are those units that are renting or selling. The share of units in this category has decreased over the last decade while household formations have increased. This type of vacancy will always exist in the market due to people selling, buying, and exiting rentals. To alleviate the housing gap, more supply is necessary, especially for those facing the highest of cost burdens. Even if the owners of those 7,517 units decided to bring them onto the market, it still wouldn’t be enough.
Dejan Eskic is a senior research fellow at the Kem C. Gardner Policy Institute.
[i] The Kem C. Gardner Policy Institute calculates the housing gap/shortage by taking the difference between new households and new permit-authorized dwelling units. The household figures are from the Gardner Institute’s Short-term Population Projections 2018–2028. The permit-authorized dwelling units data is from the Gardner Institute’s Ivory-Boyer Construction Database.
[ii] https://gardner.utah.edu/blog-a-record-hot-housing-market-where-do-we-go-from-here/
[iii] https://gardner.utah.edu/wp-content/uploads/C19RealEstateBrief-Sep2020.pdf
[iv] CBRE 2021 Greater Salt Lake Area Multifamily Market Report and UtahRealEstate.com
[v] https://www.census.gov/housing/hvs/definitions.pdf
[vi] https://www.census.gov/housing/hvs/data/histtabs.html Table 18. Quarterly Percent of “Other” Vacant Housing Units for the U.S.: 2012 to Present. Annual average of four quarters.


