
Blog Post
Insight: 2020 5-Year ACS Data Released

By: Mallory Bateman
Apr 18, 2022
COVID-19 created challenges for data collection
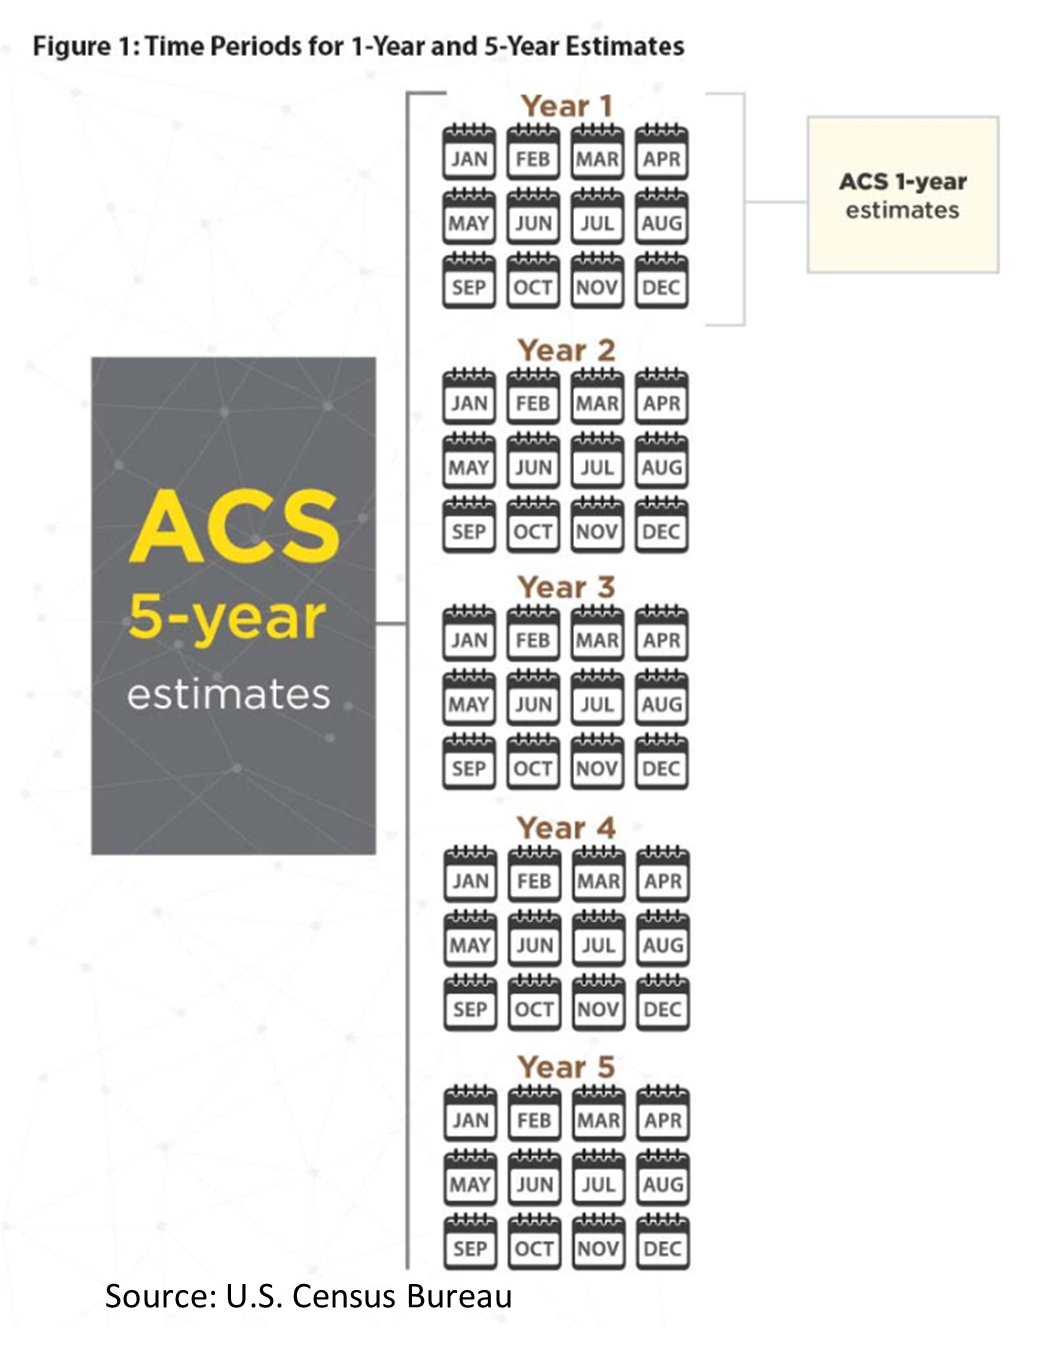
Unlike the 1-Year Estimates, which only provide insights for populations of 65,000 or more, the 5-Year Estimates provide coverage for every geography throughout the entire United States. This type of data is incredibly important for small communities, counties, and for diving deeper into the neighborhood level in larger cities. After the Census Bureau released 1-Year 2020 American Community Survey (ACS) data as a limited and experimental product, many data users were curious and concerned about what that might mean for the 5-Year Estimates.
Thankfully, the Census Bureau employed some new approaches to address the data collection issues created by the COVID-19 pandemic. In mid-March, the Census Bureau published new 5-year estimates for all geographies. While margins of error are higher than in prior 5-year estimates, we’re still able to gain an understanding of the characteristics of the population between 2016 and 2020.
The 5-year ACS produces period estimates, reflecting the results of a survey sample of the population taken across, well, five years. This is different from point estimates, like the decennial census, indicating what was happening on a single day.
40 Different Topics
One of the more frequent data calls I receive are individuals who are not excited at the prospect of completing the ACS. The ACS provides insights into over 40 topics related to how we live in the United States, asking questions covering everything from educational attainment to household heating fuel to internet availability.. While the survey is long, responses to the ACS help inform decisions across the public and private sectors on programming and funding.
A selection of Utah-specific results:
Changes mentioned are between the 2011-2015 and 2016-2020 estimate series. Visit this page for more information on how to compare ACS estimates.
The aging of the population continues
- The share of the population under age 18 decreased from 30.9% to 29.4% statewide, in 15 counties, and 28 cities.
- The share of the population aged 65 and over increased to 11.1% statewide, from 9.7% in the last estimate period.
- Twenty-four counties also experienced increases in the share of the population age 65 or older. In three counties (Washington, Garfield, and Kane), just over one-in-five residents are age 65 or over.
- The share of 65 and over residents in 33 cities increased and decreased in Bountiful, Salem, and Vineyard.
Higher shares of Utahns have a Bachelor’s degree or higher
- The share of the population with a Bachelor’s degree or higher increased in 35 cities, with the largest increases in Midway, Ivins, South Weber, Alpine, and Enoch. Tooele was the only city to experience a decrease.
Poverty decreased statewide, with differences at the county and city level
- The share of Utahns in poverty decreased from 12.8% to 9.8%. Ten counties experienced changes, with only Duchesne County experiencing an increase (10.1% to 13.7%). Twenty-six cities experienced decreases in the share of their population in poverty. North Ogden (2.9% to 6.8%), Saratoga Springs (1.5% to 4%), and Vineyard (1.1% to 9.3%) experienced increases.
While only one year of this 5-year period includes the impacts of the COVID-19 pandemic, some characteristics have changed throughout Utah communities. To dig into the data on your own, visit data.census.gov.
Mallory Bateman is the director of demographic research at the Kem C. Gardner Policy Institute.


