Blog Post
Guest Insight: Utah Job Quality Report 2020

By Matthew Weinstein, Voices for Utah Children
Note: The opinions expressed are those of the author alone and do not reflect an institutional position of the Gardner Institute. We hope the opinions shared contribute to the marketplace of ideas and help people as they formulate their own INFORMED DECISIONS™.
In honor of Labor Day earlier this month, Voices for Utah Children released the Utah Job Quality Report 2020. The report examines the quality of jobs in Utah in terms of wages, work hours, non-standard employment, safety, and other job quality criteria. The report compares Utah to the nation and to three neighboring states: Colorado, Idaho, and Nevada.
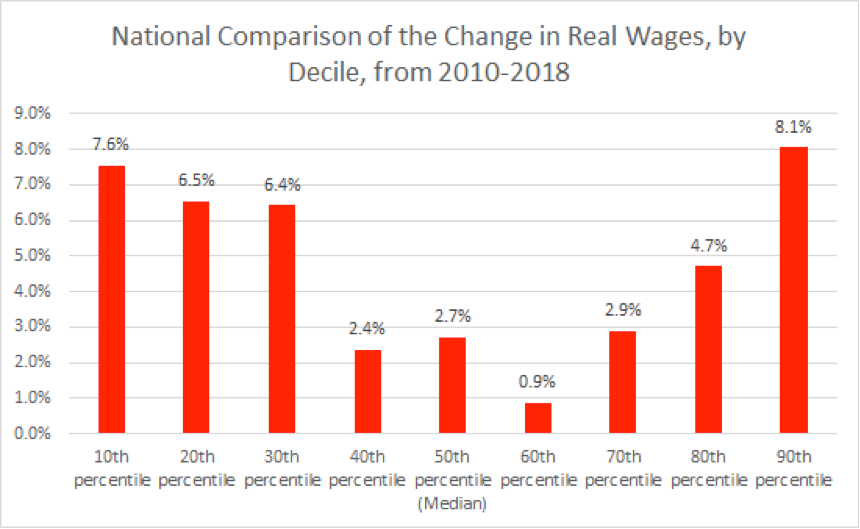
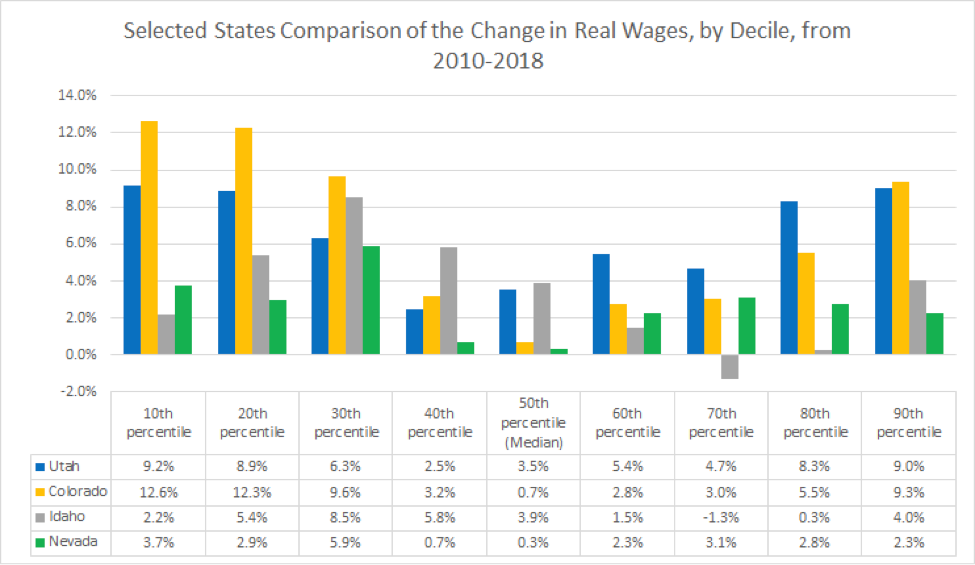
The first part of the report, primarily researched by University of Utah economics graduate student Connor Hill, looks at wage growth since 2010 at different income levels based on two different sources: the federal surveys of employers and of residents. The results include the following charts, which show that Utahns at nearly every income level outperformed the nation for wage increases from 2010 to 2018:
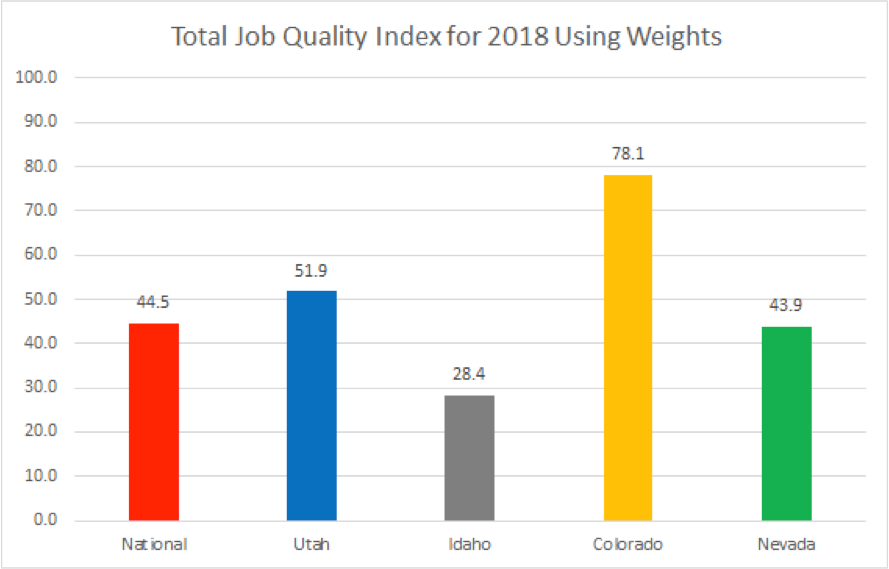
The second part of the report introduces a new innovation in Utah economics: The Utah Job Quality Index, an idea envisioned and researched by University of Utah economics undergraduate student Matthew Gordon during his spring 2020 internship with Voices for Utah Children. This is, as far as we are aware, the first effort to create a comprehensive index that makes it possible to compare Utah to the nation and to other states in the quality of jobs according to six different dimensions comprising among them 14 different criteria of job quality. The report finds that Utah scores a 51.9 on the weighted Job Quality Index (on a scale of 0-100), well above the national score of 44.5. Utah also scores higher than Nevada (43.9) and Idaho (28.4) but far below Colorado (78.1). The report breaks down the scores so that the reader can see how the four states compare to each other and the nation by each of the six dimensions and by the 14 components of the six dimensions.
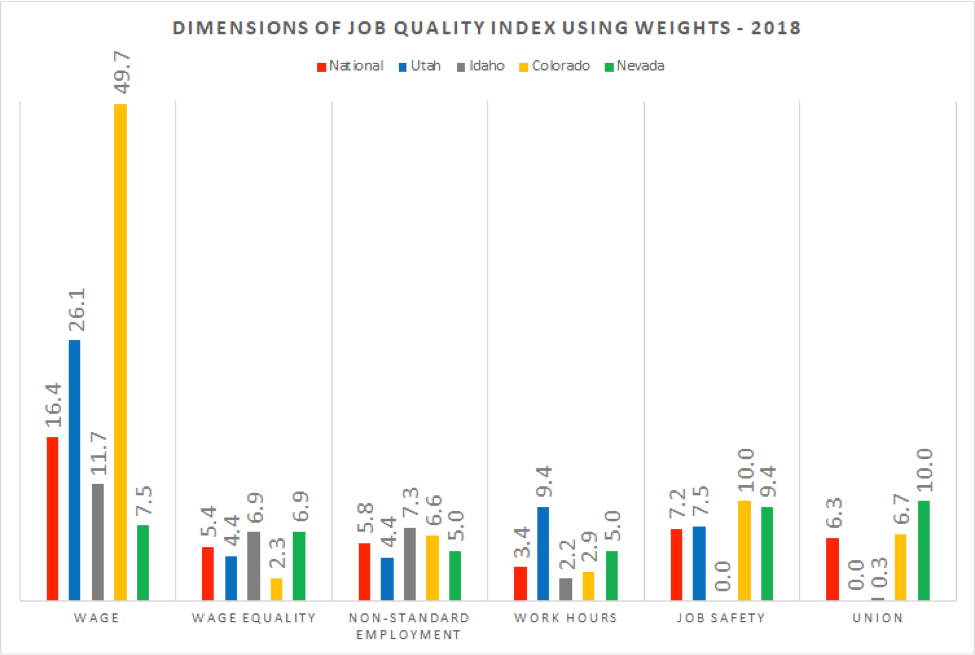
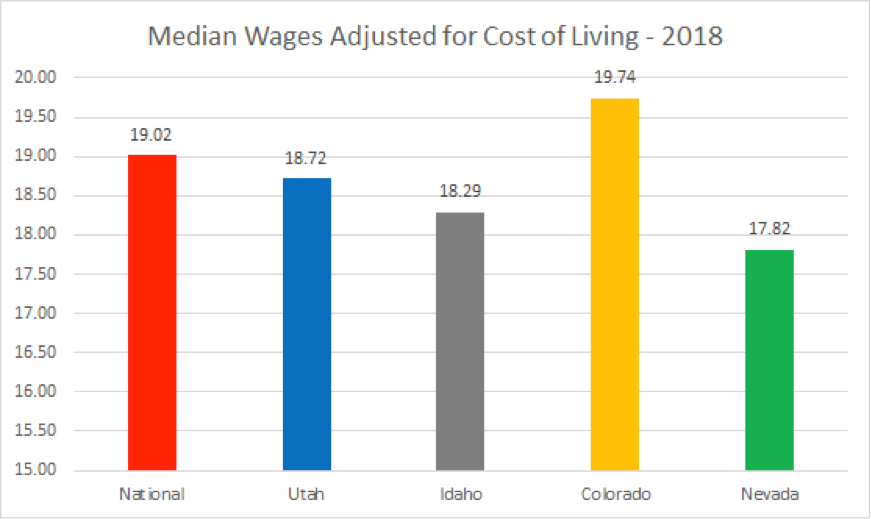
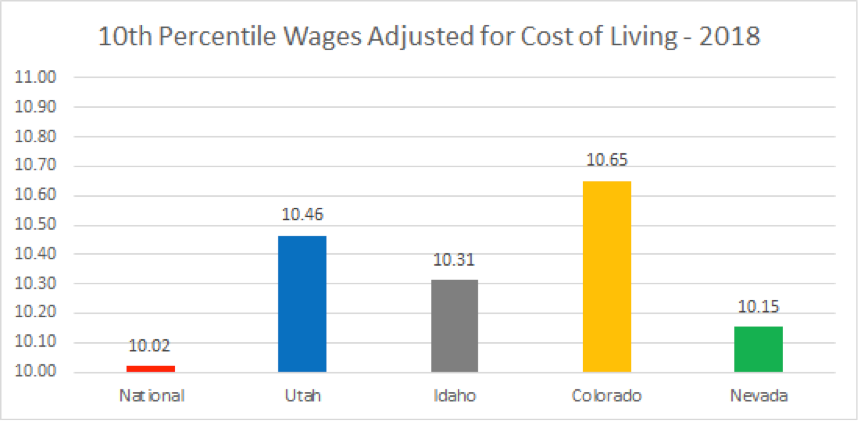
The most important dimension of the Job Quality Index and the one receiving the greatest weight — half the value of the index — is wages, including the charts below comparing hourly wages at the middle and at the bottom of the wage scale. We present the figures after adjusting for state cost of living. Most interestingly, Utah comes out below the national level at the median level but well ahead at the low end of the wage scale.
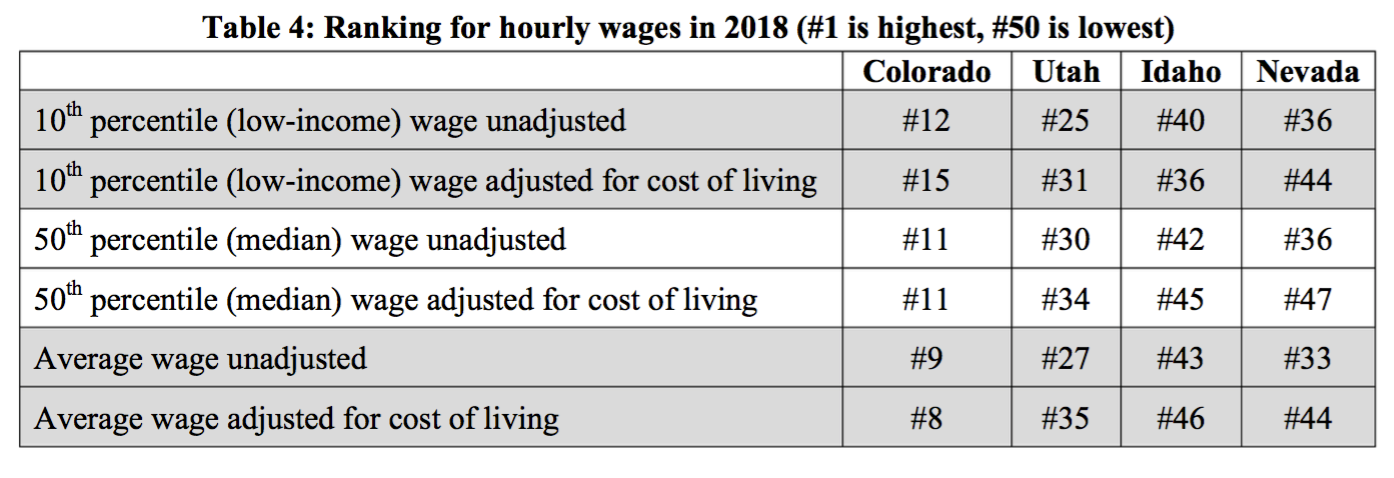
The report also includes supplemental information about some of the topics, such as the states’ rankings for wages for low-income and median-income workers, both un-adjusted and adjusted for each state’s cost of living.
The report also compares those four states and the nation in the following areas:
- Average hourly work week
- Share of workforce working part-time, including breakdowns by age and sex
- Share of workforce working multiple jobs
- Wage disparities between men and women and between Whites and Latinos
- Rate of fatal workplace accidents
- Share of workforce that are members of labor unions
Some of the results may surprise you! The entire report is now available online.
Matthew Weinstein is the State Priorities Partnership Director at Voices for Utah Children.