Blog Post
Insight: Utah’s Household Trends: A 2020 Census Perspective
By: Eric Albers and Heidi Prior
Hello, fellow Census data enthusiasts! Today, we are exploring Utah’s households, armed with the newest 2020 Census DHC Data. The household landscape changed quite a bit over the past decade. Here are some of the highlights from our newest Fact Sheet.
Utah’s household growth was the fastest in the nation.
Did you know that Utah earned the title of the fastest-growing state in the nation during the last decade? Utah earned this title in the realms of population, housing units, AND households! Between 2010 and 2020, Utah welcomed an impressive 179,560 new households, marking a 20.5% increase.
Figure 1. Utah Households by Type, 2000-2020
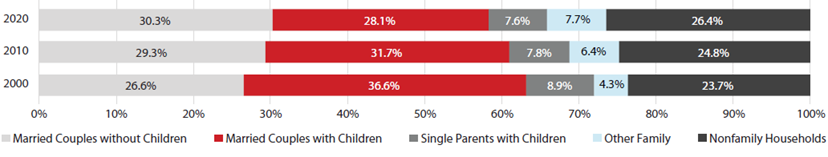
Source: U.S. Census Bureau, 2020 Census Demographic and Housing Characteristics File (DHC)
Married couples without children edged out married couples with children.
In addition to growing faster than any other state, the composition of Utah’s households is also changing. In 2000 and 2010, married couples with children were the largest share of any household type. However, by 2020, married couple households without children took the lead with a 30.3% share, while married couples with children fell to 28.1%.
Nonfamily households are increasing.
Nonfamily households include two or more members in which the householder is not related to any other members of the household. This household type has been steadily increasing since 2000 and mirrors growth in this household type at the national level. In 2020, nonfamily households made up just over a quarter (26.4%) of Utah households, coming within two percentage points of the share of married coupled households with children.
Household size is decreasing.
While Utah still has the highest share of 5-or-more-person households in the country, this share is slowly declining. In 2020, 20.4% of households included five or more members compared to 21.0% in 2010. While the share of three, four, and five-person households decreased last decade, the percentage of one and two-person households increased. Nationally, the share of residents living alone also increased, as it has since the 1940s.
Figure 2. Utah Households by Size, 2000-2020
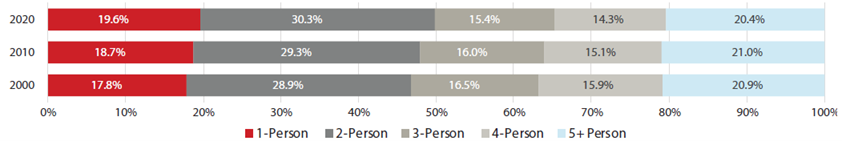
Source: U.S. Census Bureau, 2020 Census Demographic and Housing Characteristics File (DHC)
Other notable changes in Utah’s households and living arrangements:
-
- Utah’s homeownership rate dropped from 70.4% to 69.0%.
-
- The share of:
-
- Renting households increased from 29.6% to 31.0%.
-
- Utahns living alone increased from 18.7% to 19.6%.
-
- Multigenerational households increased from 4.6% to 4.9%.
-
- The share of:
Utah’s households continue to grow quickly while changing in ways that have important implications for our state. For those looking for additional data details, head over to our 2020 Census Dashboard—a comprehensive resource for navigating Utah’s evolving demographic trends.
Eric Albers and Heidi Prior are public policy analysts at the Kem C. Gardner Policy Institute.