Blog Post
Insight: New Detailed Race and Ethnic Group Insights from 2020 Census
By: Mallory Bateman and Heidi Prior
Today the Census Bureau released new data on racial and ethnic groups, providing insights into 300 detailed race and ethnic groups and over 1,100 American Indian and Alaska Native tribes and villages. This data was collected as part of the 2020 census and comes from <a href=”https://www.census.gov/newsroom/press-releases/2023/2020-census-detailed-dhc-file-a.html”>the Detailed Demographic and Housing Characteristics File A (Detailed DHC-A</a>).<!–more–>
When you filled out your 2020 census questionnaire, you were given the opportunity to provide additional detail describing both your racial and ethnic identity. For example, after checking the box for Black or African American, an individual could write in a specific race, like Nigerian. These additional details, provided by census takers around the country, compose the wealth of data available in this new census product.
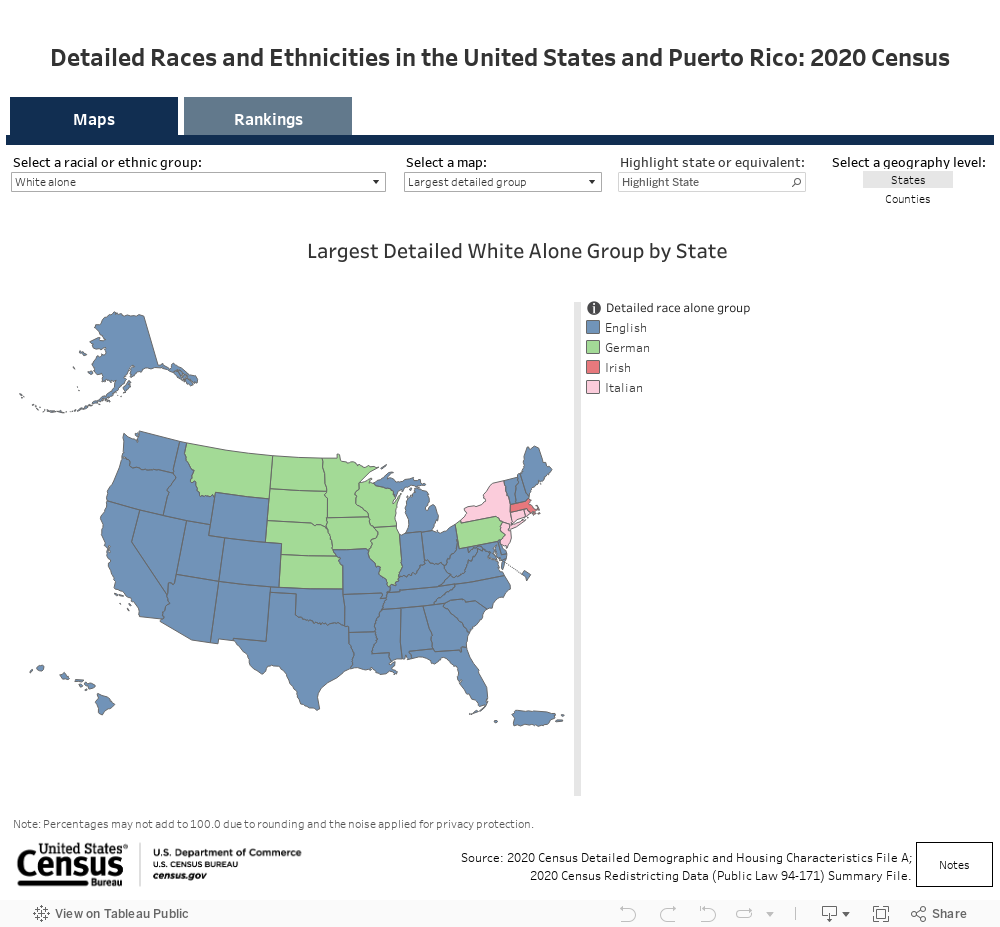
<img class=”size-full wp-image-23853 aligncenter” src=”https://gardner.utah.edu/wp-content/uploads/Demog-Blog-Sept21-Image-1.png” alt=”” width=”476″ height=”671″ />
New insights into Utah include:
<ul>
<li><a href=”https://www.census.gov/library/stories/2023/09/2020-census-dhc-a-nhpi-population.html”>The Tongan population in Salt Lake County is the largest county-level population in the nation at 12,859 residents.</a> Tongan is also the most common single race selected by Utah’s Pacific Islanders statewide.</li>
<li>Over 326,000 Utahns identify as Mexican, the largest detailed racial group in the state.</li>
<li>Utah’s South American population includes more than 50,000 residents, a quarter of whom identify as Peruvian.</li>
<li>More than 62,000 Utahns include American Indian as part of their racial identity, with more than 21,000 listing the Navajo Nation when describing their race.</li>
<li>Over 15,700 Utah residents include a Middle Eastern or North African country as part of their racial or ethnic background.</li>
<li>Utah’s Black population largely identifies as African American, with over 27,000 people including this group as part or all of their identity. Additionally, more than 10,000 Utahns list a single Sub-Saharan African country when describing their race.</li>
<li>Chinese was Utah’s largest Asian population group, with over 25,000 residents selecting Chinese either alone or in combination with other races. Over 20,000 Utahns selected Filipino as one of their racial groups, the second most common Asian race in the state.</li>
</ul>
The availability of Detailed DHC-A data depends on the size of the population group, but insights are available across the state, for all counties, cities, towns, and Census Designated Places. The file also provides age details for many of these populations, again, dependent on population size.
While we continue to explore this data and create Utah-specific products at the Gardner Institute, you can <a href=”https://www.census.gov/newsroom/press-kits/2023/2020-detailed-dhc-file-a.html”>dive into the tables and technical documentation on your own</a>.
<em>Mallory Bateman is the director of demographic research at the Kem C. Gardner Policy Institute.</em>
<em>Heidi Prior is a public policy analyst at the Kem C. Gardner Policy Institute. </em>