Blog Post
Insight: Access New Community Data with the Census 2020 Utah Redistricting Data Dashboard

By: Eric Albers and Emily Harris
After months of anxiously waiting, we have finally received the next round of Census 2020 results! On August 12th, the Census Bureau released its third phase of Census 2020 data products: the redistricting data. This data’s primary purpose is redistricting, so while it goes down to the smallest geographic level possible, it does not have the full level of demographic detail that later data releases will have. Additionally, the initial data format is not particularly user-friendly, so cleaning, aggregation, and analysis is required.
That’s where we come in.
The Kem C. Gardner Policy Institute did all the hard work for you, and created the Census 2020 Utah Redistricting Data Dashboard. This allows users to explore Utah-specific results of total population, housing, and race and ethnicity at the state, county, and city/place level.
Want to download the data? You can do that. Want to turn the graphics into a PDF or image? You can do that too! Want to spend hours flipping through dynamic visualizations that tell you about the demographic changes happening in your city or county? Totally.
Here are some tips and tricks on how to use the dashboard:
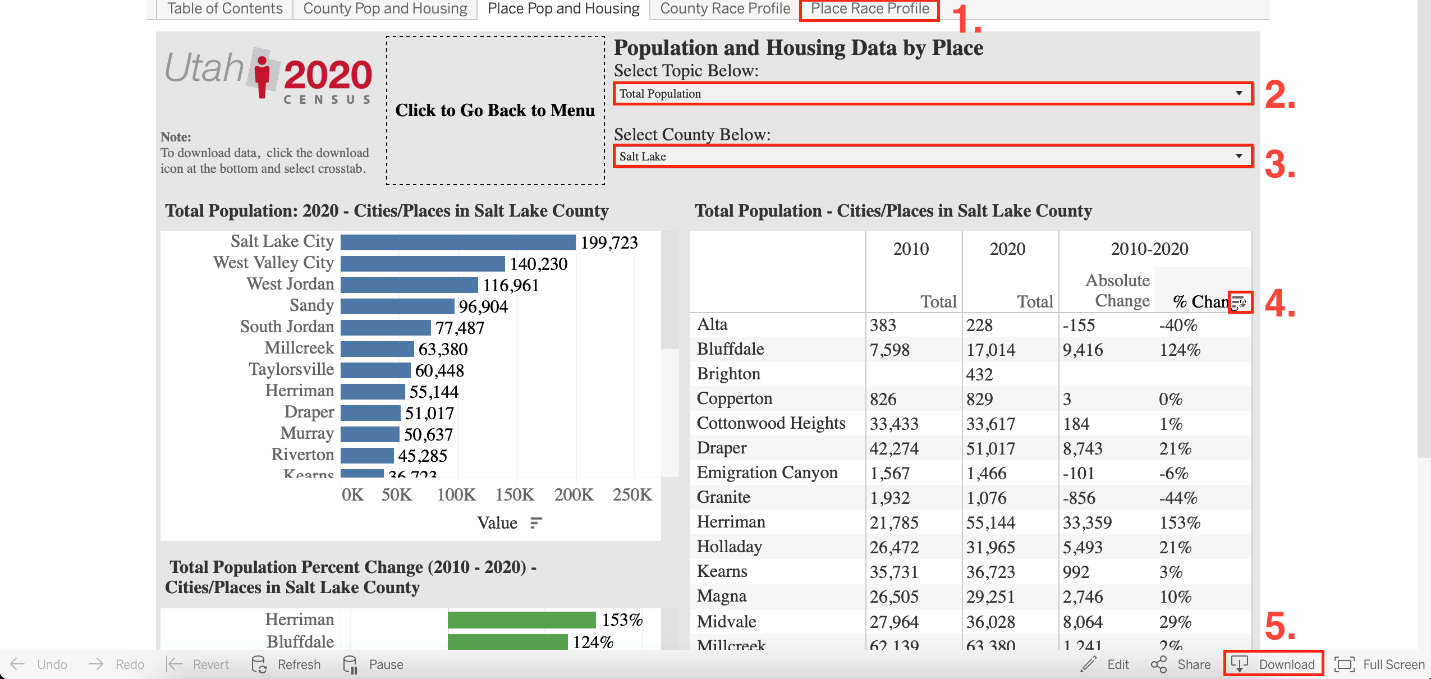
- The data is most easily viewed on a desktop, laptop, or tablet web browser. It is not optimized for use on cell-phones. Depending on the size of your browser, it may be necessary to scroll down to see all of the content. Additionally, several tables and graphs have scroll bars.
- The Table of Contents allows for easy navigation to the topics you are interested in. To change topics, you can return to the Table of Contents using the “Click to Go Back to Menu” button. You can also use the tabs at the top of the page (see Item 1).
- Drop down menus allow you to select specific topics and geographies within each tab (see Items 2 & 3).
- To sort the data, hover over column names, and a button will appear allowing you to sort the data (see Item 4).
- To download the data in a table or graph click on the “Download” button at the bottom of the screen, select “Crosstab”, then select the data that you want to download (see Item 5).
To access the raw data used for these dashboards, visit this Census Bureau webpage. The Gardner Institute will continue providing more Utah-specific fact sheets, reports, and events related to the Census 2020 redistricting data over the coming weeks, so stay tuned for more demographic analysis of the 2020 Census.
Suggested Data Citation: 2020 Census State Redistricting Data (Public Law 94-171) Summary File, U.S. Census Bureau
Eric Albers is a research associate at the Kem C. Gardner Policy Institute.
Emily Harris is a senior demographer at the Kem C. Gardner Policy Institute.