Blog Post
Insight: New Data Sheds Light on Utah’s Shifting Demographics
By: Dr. Pamela S. Perlich, Ph.D.
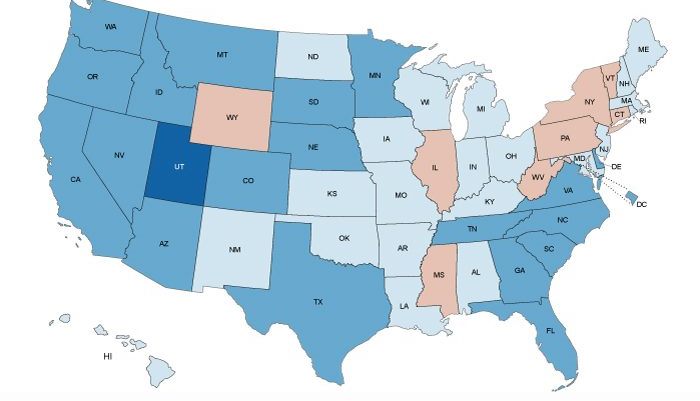
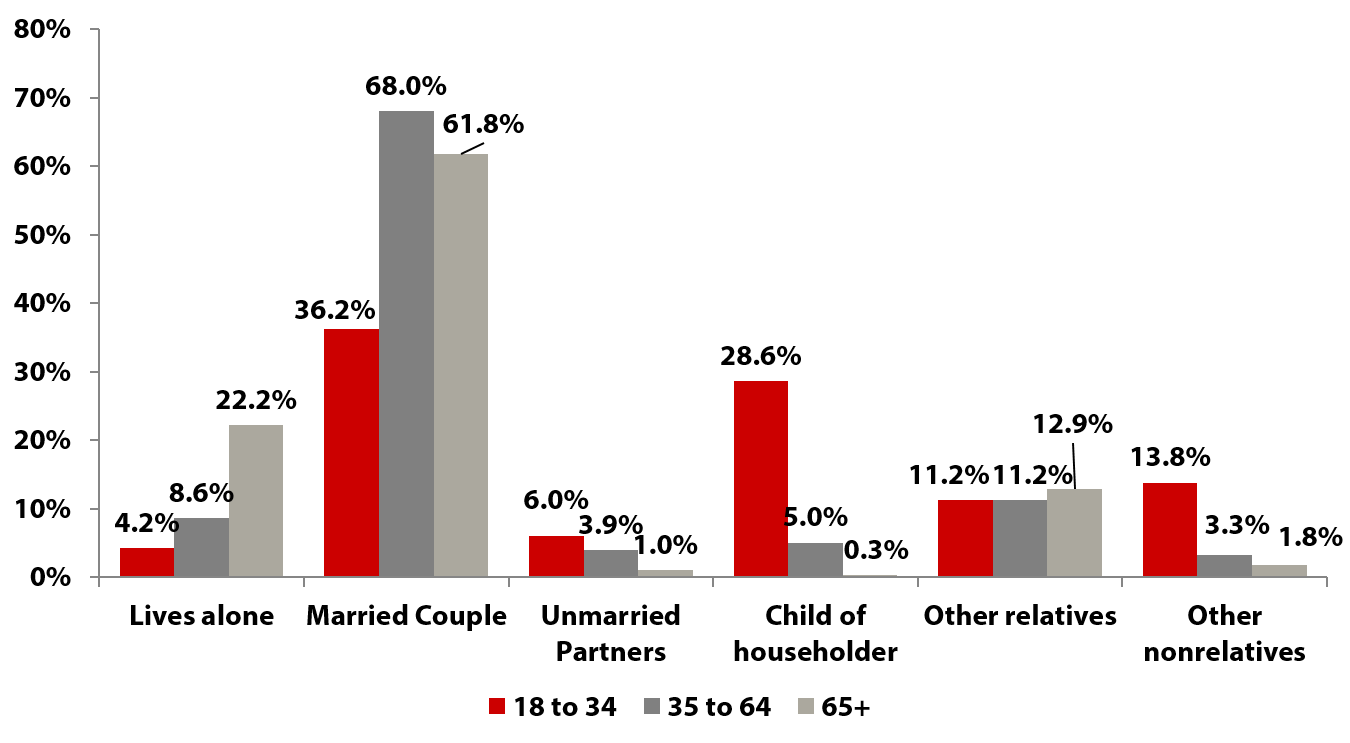
This past week, the U.S. Census Bureau released the 2015 American Community Survey 1-year estimates. Utah remains the youngest state in the nation with a median age of 30.6, an increase from 29.2 in 2010. Nationally median age is 37.8, an increase from 37.2 in 2010. Births rates in Utah are consistently the highest in the nation. According to these data, Utah women had children at a rate of 68 per 1,000 women 15 to 50 years old (who had a birth in the past 12 months) in 2015, down from 78 per 1,000 women 15 to 50 in 2010. This compares to a rate of 51 per 1,000 nationally in 2015, also down since 2010 when it was 55 per 1,000 women 15 to 50. This downward trend, the combined effect of falling births and birthrates, as well as rising ages for marriage and childbearing, has been compounded by the Great Recession. Births rates should increase as the economy improves. Utah continues to have the largest household sizes in the nation. Average household size in Utah is estimated to be 3.17 in 2015, which is an increase from the 2010 level of 3.10. The average family size was 3.67 in 2015, an increase from 3.57 in 2010. The same trend can be seen nationally, although to a lesser extent, with average household size increasing to 2.65 in 2015, as compared to 2.63 in 2010. The average family size in the nation was 3.26 in 2015. The increasing average household size is a reversal of a longer term trend, and is further evidence of the severity of the Great Recession, which has delayed household formation of young adults and has resulted in “doubling up” of multiple households. This data set presents a new tabulation for living arrangements of adults. It shows that over a quarter (28.6 percent) of young adults (ages 18 through 34) live with a parent(s). This compares to 34.1 percent nationally. Note: The average household size and for 2015 is not significantly different (at a 90% confidence level) from 2014 and 2013 estimate. The average family size estimate for 2015 is not significantly different (at a 90% confidence level) from 2014, 2013, 2012 or 2011 estimate. Source: U.S. Census Bureau, 2015 American Community Survey 1-Year Estimates Immigration flows to Utah and the nation have declined significantly since the onset of the Great Recession. Source regions of immigrants to Utah have also shifted as the recovery has advanced. These estimates indicate that Utah’s foreign born population increased to 244,467 people, or 8.2 percent of the Utah population in 2015. This is an increase from 2010 when this group was 222,638 persons or 8 percent of the total population. Our major source region continues to be Latin America (60.5 percent), but this share has decreased. In contrast, immigrants from Asia increased to one-fifth (20 percent) of Utah’s foreign born population, up from an estimated 17 percent in 2010. Evidence of Utah’s economic recovery is seen in increasing median income, health insurance coverage and declines in poverty rates. The median household income in 2015 in Utah was $62,912, the 14th highest in the nation and an increase from the 2010 median household income of $59,285. The national median household income increased to 55,775, an increase from $53,836 in 2010. There was a decrease in the percent of people in Utah without health insurance coverage from 15.3 percent in 2010 to 10.5 percent in 2015. People in poverty decreased from 13.2 percent in 2010 to 11.3 percent in 2015. Note: Income figures for 2010 and 2015 are significantly different (at a 90% confidence level) Source: U.S. Census Bureau, 2015 American Community Survey 1-Year Estimates Note: The poverty estimate for 2014 is not significantly different (at a 90% confidence level) from 2015 estimate. This data release is one of our most anticipated and broadly informative sources of socioeconomic and demographic information about our state. In general, it shows that Utah maintains its unique demographics, although it is trending towards the nation. Further, the relative strength of Utah’s economy is apparent. Median Age Data available here. Birth Rates are available here. Household and Family Size are available here. Living arrangements of adults is available here. Foreign born data is here. [i] Survey data was collected each month and these are combined to a set of period estimates for 2015. While the survey is statewide, sample sizes limit the reporting of data to areas with populations of at least 65,000. Dr. Pamela Perlich is the director of demographic research at the Kem C. Gardner Policy Institute.Average Household and Family Size in Utah
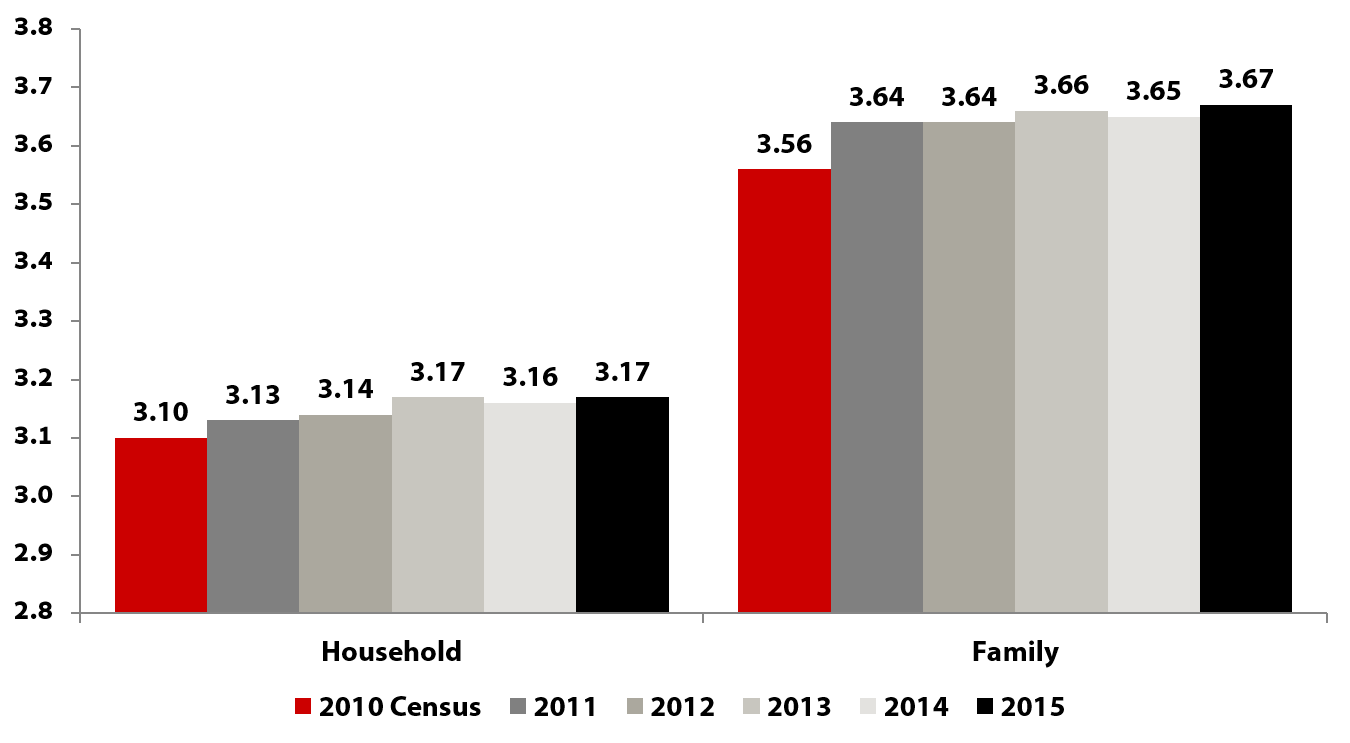
Source: U.S. Census Bureau, 2015 American Community Survey 1-Year EstimatesLiving Arrangement of Adults 18 Years and Over in Utah, 2015
Income in Utah

Poverty and Health Insurance in Utah
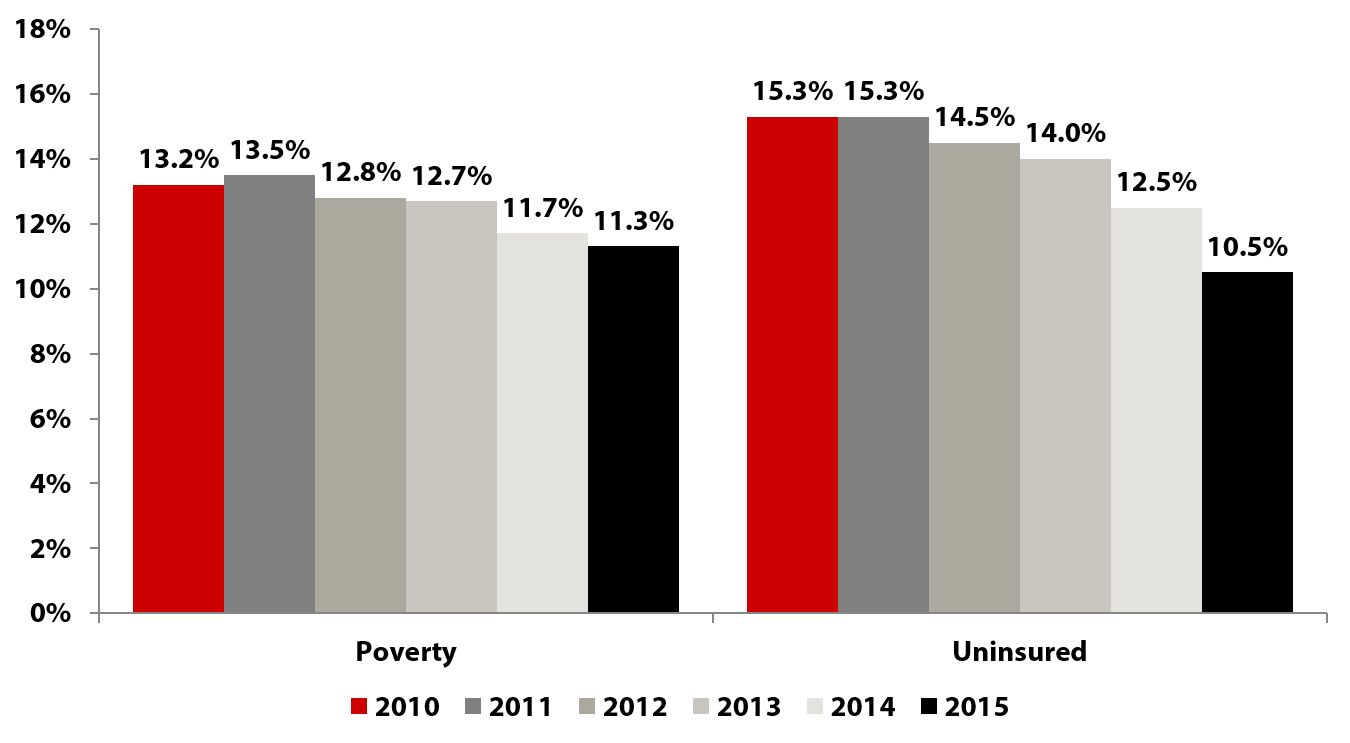
Source: U.S. Census Bureau, 2015 American Community Survey 1-Year Estimates